SanDisk Ultra Plus SSD Review (256GB)
by Anand Lal Shimpi on January 7, 2013 9:00 AM ESTPerformance Consistency
In our Intel SSD DC S3700 review I introduced a new method of characterizing performance: looking at the latency of individual operations over time. The S3700 promised a level of performance consistency that was unmatched in the industry, and as a result needed some additional testing to show that. The reason we don't have consistent IO latency with SSDs is because inevitably all controllers have to do some amount of defragmentation or garbage collection in order to continue operating at high speeds. When and how an SSD decides to run its defrag and cleanup routines directly impacts the user experience. Frequent (borderline aggressive) cleanup generally results in more stable performance, while delaying that can result in higher peak performance at the expense of much lower worst case performance. The graphs below tell us a lot about the architecture of these SSDs and how they handle internal defragmentation.
To generate the data below I took a freshly secure erased SSD and filled it with sequential data. This ensures that all user accessible LBAs have data associated with them. Next I kicked off a 4KB random write workload across all LBAs at a queue depth of 32 using incompressible data. I ran the test for just over half an hour, no where near what we run our steady state tests for but enough to give me a good look at drive behavior once all spare area filled up.
I recorded instantaneous IOPS every second for the duration of the test. I then plotted IOPS vs. time and generated the scatter plots below. Each set of graphs features the same scale. The first two sets use a log scale for easy comparison, while the last set of graphs uses a linear scale that tops out at 40K IOPS for better visualization of differences between drives.
The high level testing methodology remains unchanged from our S3700 review. Unlike in previous reviews however, I did vary the percentage of the drive that I filled/tested depending on the amount of spare area I was trying to simulate. The buttons are labeled with the advertised user capacity had the SSD vendor decided to use that specific amount of spare area. If you want to replicate this on your own all you need to do is create a partition smaller than the total capacity of the drive and leave the remaining space unused to simulate a larger amount of spare area. The partitioning step isn't absolutely necessary in every case but it's an easy way to make sure you never exceed your allocated spare area. It's a good idea to do this from the start (e.g. secure erase, partition, then install Windows), but if you are working backwards you can always create the spare area partition, format it to TRIM it, then delete the partition. Finally, this method of creating spare area works on the drives I've tested here but not all controllers may behave the same way.
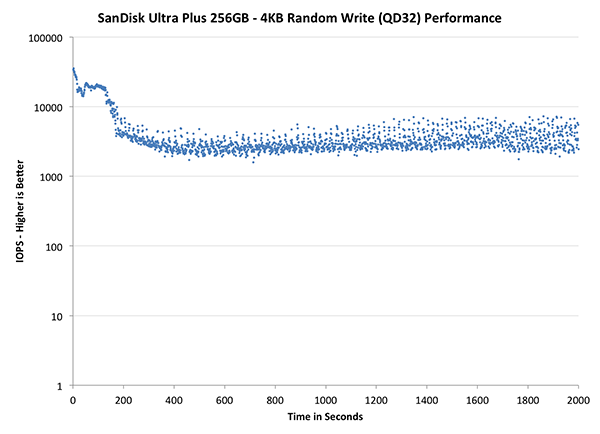
The first set of graphs shows the performance data over the entire 2000 second test period. In these charts you'll notice an early period of very high performance followed by a sharp dropoff. What you're seeing in that case is the drive alllocating new blocks from its spare area, then eventually using up all free blocks and having to perform a read-modify-write for all subsequent writes (write amplification goes up, performance goes down).
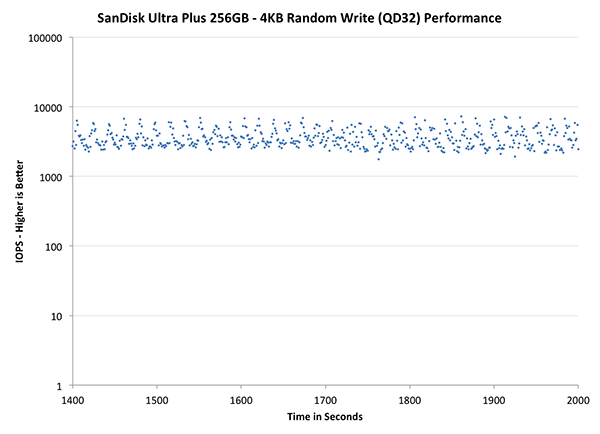
The second set of graphs zooms in to the beginning of steady state operation for the drive (t=1400s). The third set also looks at the beginning of steady state operation but on a linear performance scale. Click the buttons below each graph to switch source data.
| Impact of Spare Area | |||||||
| Intel SSD DC S3700 200GB | Corsair Neutron 240GB | OCZ Vector 256GB | Samsung SSD 840 Pro 256GB | SanDisk Ultra Plus 256GB | |||
| Default | |||||||
| 25% Spare Area | - | ||||||
The Ultra Plus' performance consistency, at least in the default configuration, looks a bit better than Samsung's SSD 840 Pro. The 840 Pro is by no means the gold standard here so that's not saying too much. What is interesting however is that the 840 Pro does much better with an additional 25% spare area compared to the Ultra Plus. SanDisk definitely benefits from more spare area, just not as much as we're used to seeing.
The next set of charts look at the steady state (for most drives) portion of the curve. Here we'll get some better visibility into how everyone will perform over the long run.
| Impact of Spare Area | |||||||
| Intel SSD DC S3700 200GB | Corsair Neutron 240GB | OCZ Vector 256GB | Samsung SSD 840 Pro 256GB | SanDisk Ultra Plus 256GB | |||
| Default | |||||||
| 25% Spare Area | - | ||||||
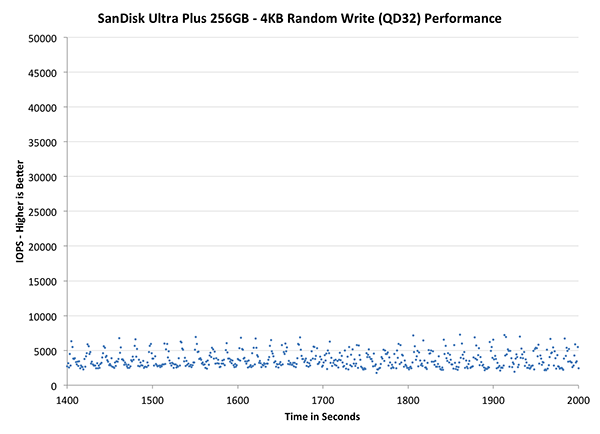
The final set of graphs abandons the log scale entirely and just looks at a linear scale that tops out at 50K IOPS. We're also only looking at steady state (or close to it) performance here:
| Impact of Spare Area | |||||||
| Intel SSD DC S3700 200GB | Corsair Neutron 240GB | OCZ Vector 256GB | Samsung SSD 840 Pro 256GB | SanDisk Ultra Plus 256GB | |||
| Default | |||||||
| 25% Spare Area | - | ||||||
Here we see just how far performance degrades. Performance clusters around 5K IOPS, which is hardly good for a modern SSD. Increasing spare area helps considerably, but generally speaking this isn't a drive that you're going to want to fill.


38 Comments
View All Comments
Flunk - Monday, January 7, 2013 - link
If you want real performance you could make a versio of this that features two of these PCBs along with a RAID chip for enhanced performance. All in a 2.5" form factor would be quite compelling.bmgoodman - Monday, January 7, 2013 - link
Sorry, but after the way SanDisk handled the TRIM issue on their SanDisk Extreme hard drives last year, I will NEVER buy from them again. I understand mistakes are made and things don't go as expected, but for the longest time they simply would not comment at all on the problem. Their response plan to bury their heads in the sand is NOT a strategy for good customer support.Quoth the raven, "nevermore!"
magnetar - Monday, January 7, 2013 - link
IMO, SanDisk handled the SandForce 5.0 firmware TRIM issue as it needed to be dealt with, carefully and professionally.The weak statement about it from a SanDIsk forum moderator that was buried in a thread started by a SanDisk customer was apparently missed by most of those concerned about this issue. That was a mistake. Responding to angry demands for a release date is not professional.
The other SSD manufactures that provided the fixed firmware very quickly were not doing their customers a favor. That indicated to me that those manufactures did very little testing and verification of the new firmware. Considering that all the SSD manufactures that used the 5.0 firmware, and SandForce itself missed finding the problem, a careful approach with the new firmware was warranted.
The firmware update SanDisk provided not only included the fixed firmware, but other fixes as well, including a fix for the incorrect temperature reading some of the Extreme SSDs had. SanDisk chose to provide one update with multiple fixes, rather than multiple firmware updates, which was the better option IMO. The more firmware updates necessary, the less professional the product is.
The R211 firmware update program SanDisk provided was the best one I've ever used. Running in Windows, it worked with the SanDisk Ex connected to the Marvell 9128 SATA chipset! Any other firmware update programs can do that? The lack of complaints about that firmware update program in the SanDisk forum also indicates how good it is.
No blemish on SanDisk IMO, actually exactly the opposite.
Kevin G - Monday, January 7, 2013 - link
Looking at the PCB for this drive makes me feel that this was a precursor to an mSATA version down the road. Hacking off the SATA and power connector for an edge connector looks like it'd be the right size. Kinda makes one wonder why they just didn't using a mSATA to SATA adapter in a 2.5" enclosure and launch both products simultaneously.Kristian Vättö - Monday, January 7, 2013 - link
SanDisk X110 was launched alongside the Ultra Plus, which is essentially an mSATA version of the Ultra Plus.perrydoell - Tuesday, January 8, 2013 - link
How about making the PCB 4x larger... 1GB SSD drive!vanwazltoff - Monday, January 7, 2013 - link
most companies purposely put out a high performing ssd and a low performing ssd, this probably their low end or more likely they are trying to shrink power consumption and size for smaller form factors such as tablets. sandisks extreme ssd went toe to toe with an 830 and proved itself a worthy component with more leveled results than an 830. i am sure they will have answer to the 840 pro soon enoughDeath666Angel - Monday, January 7, 2013 - link
The Extreme was a normal SF-2281 offering with Toggle Mode NAND. Nothing fancy about that imho.iaco - Monday, January 7, 2013 - link
64 GB packages. Verrrry nice.Tells me what we've known all along: Apple has no excuse charging obscene prices for NAND on their iPads, iPhones and Macs. 64 GB probably costs what, $50 at retail? Apple wants $200 to upgrade from 16 to 64 GB.
Maybe they'll finally get around to updating the iPod classic.
Kristian Vättö - Monday, January 7, 2013 - link
8GB 2-bit-per-cell MLC contract price is currently $4.58 ($0.57) on average according to inSpectrum. That would put the cost of 64GB MLC NAND to $36.50. Price depends on quality, though, but smartphones/tablets in general don't use the highest quality NAND (the best dies are usually preserved for SSDs, the second tier NAND is for phones/tablets).