Corsair Neutron & Neutron GTX: All Capacities Tested
by Kristian Vättö on December 19, 2012 1:10 PM ESTThe Drives
Corsair surprised us all at Computex this year when they announced their Neutron and Neutron GTX SSDs based on a so-far relatively unknown Link A Media Devices (LAMD) controller. While LAMD was new to the consumer-grade SSD controller market, the company had been making controllers for hard drives and enterprise SSDs for years, so the LM87800 found inside Neutron SSDs wasn't LAMD's first attempt in the storage world. The experience LAMD has gathered in the enterprise world is definitely visible in the LM8700 because even though its LAMD's first consumer-grade controller, it was not dwarfed by SandForce or Marvell.
Overall we were pleasantly surprised with the Neutron when we first reviewed it. There's always room for more competition because not only will it lead to lower prices, it will also provide the market with better products. Lately the consumer SSD market has been flooded with SandForce based SSDs, so it was very refreshing to see something new for a change.
Corsair only sampled the 240GB Neutron and Neutron GTX at the time of the release, which is a common practice among manufacturers. Stock is obviously limited and manufacturers want to get as many units as possible to retailers because ultimately that is what generates them revenue and profit. 240/256GB is usually the sweet-spot in terms of price and performance; smaller capacities perform worse due to less NAND die and higher capacities don't bring any improvements because the bottlenecks are elsewhere (*cough* SATA 6Gbps).
Now, three months later, Corsair finally sent us the rest of the available capacities. Testing different capacities is crucial, especially if the drive has a new controller, because controllers and firmware are designed differently and some design choices result in bigger differences between smaller and larger capacities. For example, the 128GB Vertex 4 is almost as fast as its 256GB and 512GB siblings, whereas the difference between 120GB and 240GB Vertex 3 ranges from negligible to as much as 50-75% (e.g. in write-heavy scenarios). Here's the quick rundown of the various drives.
| Neutron | Neutron GTX | ||||
| Capacity | 120GB | 240GB | 120GB | 240GB | 480GB |
| Raw NAND Capacity | 128GiB | 256GiB | 128GiB | 256GiB | 512GiB |
| NAND | Micron 25nm synchronous MLC | Toshiba 24nm Toggle-Mode 2.0 NAND | |||
| Cache | 128MB | 128MB | 128MB | 128MB | 256MB |
| Sequential Read | 555MB/s | 555MB/s | 555MB/s | 555MB/s | 555MB/s |
| Sequential Write | 211MB/s | 370MB/s | 330MB/s | 511MB/s | 511MB/s |
| 4KB Random Read | 50K IOPS | 85K IOPS | 80K IOPS | 85K IOPS | 90K IOPS |
| 4KB Random Write | 86K IOPS | 87K IOPS | 90K IOPS | 90K IOPS | 85K IOPS |
| Warranty | 5 years | ||||
Toshiba's Toggle-Mode NAND is quite a bit faster than Micron's synchronous ONFi NAND as you can see in the table above. The 120GB Neutron is substantially slower than the 120GB Neutron GTX and there is also a noticeable difference at the capacity of 240GB. Corsair isn't offering a 480GB Neutron so if you're looking for a drive bigger than 240GB, you'll have to pay the premium for the Neutron GTX. Quite a few manufacturers, such as Intel and Plextor, have similar product schemes where only the high-end model offers the highest capacities (Intel SSD 330 tops out at 240GB and Plextor M5S at 256GB).
| Comparison of NAND Interfaces | ||||||
| ONFi | Toggle-Mode | |||||
| Manufacturers | IMFT (Intel, Micron, Spectec), Hynix | Toshiba/SanDisk, Samsung | ||||
| Version | 1.0 | 2.0 | 2.x | 3.0 | 1.0 | 2.0 |
| Max Bandwidth | 50MB/s | 133MB/s | 200MB/s | 400MB/s | 166MB/s | 400MB/s |
The Toggle-Mode interface can currently provide up to twice the bandwidth of ONFi. The interface alone isn't the reason for the difference in performance; Toshiba's NAND is also considerably faster when it comes to program times based on the data I've seen, which would explain why only write speeds are slower on the Neutron.
| Price Comparison (12/18/2012) | |||||
| 120/128GB | 240/256GB | 480/512GB | |||
| Corsair Neutron GTX | $130 | $225 | $455 | ||
| Corsair Neutron | $120 | $190 | N/A | ||
| Corsair Force GS | N/A | $200 | $410 | ||
| Corsair Force GT | $130 | $220 | $440 | ||
| Plextor M5 Pro | $125 | $200 | $460 | ||
| Plextor M5S | $105 | $200 | N/A | ||
| Crucial m4 | $110 | $190 | $383 | ||
| Intel SSD 520 | $129 | $220 | $445 | ||
| Intel SSD 330 | $113 | $179 | N/A | ||
| Samsung SSD 840 Pro | $139 | $260 | $577 | ||
| Samsung SSD 840 | $100 | $169 | $315 | ||
| OCZ Vector | $150 | $270 | $555 | ||
| OCZ Vertex 4 | $108 | $210 | $458 | ||
Neither the Neutron or the Neutron GTX is the cheapest SSD available, but the pricing is still fair. Compared to the OCZ Vector or Samsung SSD 840 Pro, the Neutron GTX is actually quite a bit cheaper, although performance is at a different level as well. As always, prices fluctuate a lot so it's hard to draw any conclusions based on one day's pricing—it can be totally different in less than a week.
In fact, just to show you how prices fluctuate, here's the same table as above, only with prices from just over two weeks ago; I've italicized and bolded the differences, which you can see is about 80% of the SSDs we've listed. Sure, it's the Christmas season and so we're more prone than ever to price fluctuations, but in particular some of the newer drives (like the Samsung 840 500GB) as well as some of the older outgoing models (e.g. OCZ Vertex 4 and Intel 520) have seen some pretty heft price cuts. Be sure to shop around!
| Price Comparison (12/1/2012) | |||||
| 120/128GB | 240/256GB | 480/512GB | |||
| Corsair Neutron GTX | $140 | $230 | $470 | ||
| Corsair Neutron | $120 | $205 | N/A | ||
| Corsair Force GS | N/A | $220 | $450 | ||
| Corsair Force GT | $130 | $220 | $440 | ||
| Plextor M5 Pro | $130 | $250 | $460 | ||
| Plextor M5S | $110 | $200 | N/A | ||
| Crucial m4 | $110 | $200 | $385 | ||
| Intel SSD 520 | $130 | $250 | $490 | ||
| Intel SSD 330 | $115 | $200 | N/A | ||
| Samsung SSD 840 Pro | $194 | $270 | $600 | ||
| Samsung SSD 840 | $105 | $179 | $392 | ||
| OCZ Vector | $160 | $290 | $570 | ||
| OCZ Vertex 4 | $140 | $236 | $475 | ||
Inside the Drives
| NAND Type | NAND Configuration | NAND Part Number | |
| Neutron | |||
| 120GB | Micron 25nm synchronous MLC | 16x 8GiB packages | 29F64G08CBAAB |
| 240GB | 16x 2x8GiB packages | 29F128G08CFAAB | |
| Neutron GTX | |||
| 120GB | Toshiba 24nm Toggle-Mode MLC | 8x 2x8GiB packages | TH58TEG7D2HBA4C |
| 240GB | 8x 4x8GiB packages | TH58TEG8D2HBA4C | |
| 480GB | 8x 8x8GiB packages | TH58TEG9D2HBA4C |

Neutron GTX 120GB and 480GB
In general, the only difference between the various capacities is the amount of cache and NAND per die. The 480GB model is the only one with 256MB (two 128MB chips) of cache; other models have 128MB. Both DRAM caches are DDR2-800 like in the 240GB Neutron GTX, but Corsair has opted for Micron's DRAM in the 480GB model whereas the 120GB and 240GB models use DRAM from Samsung.
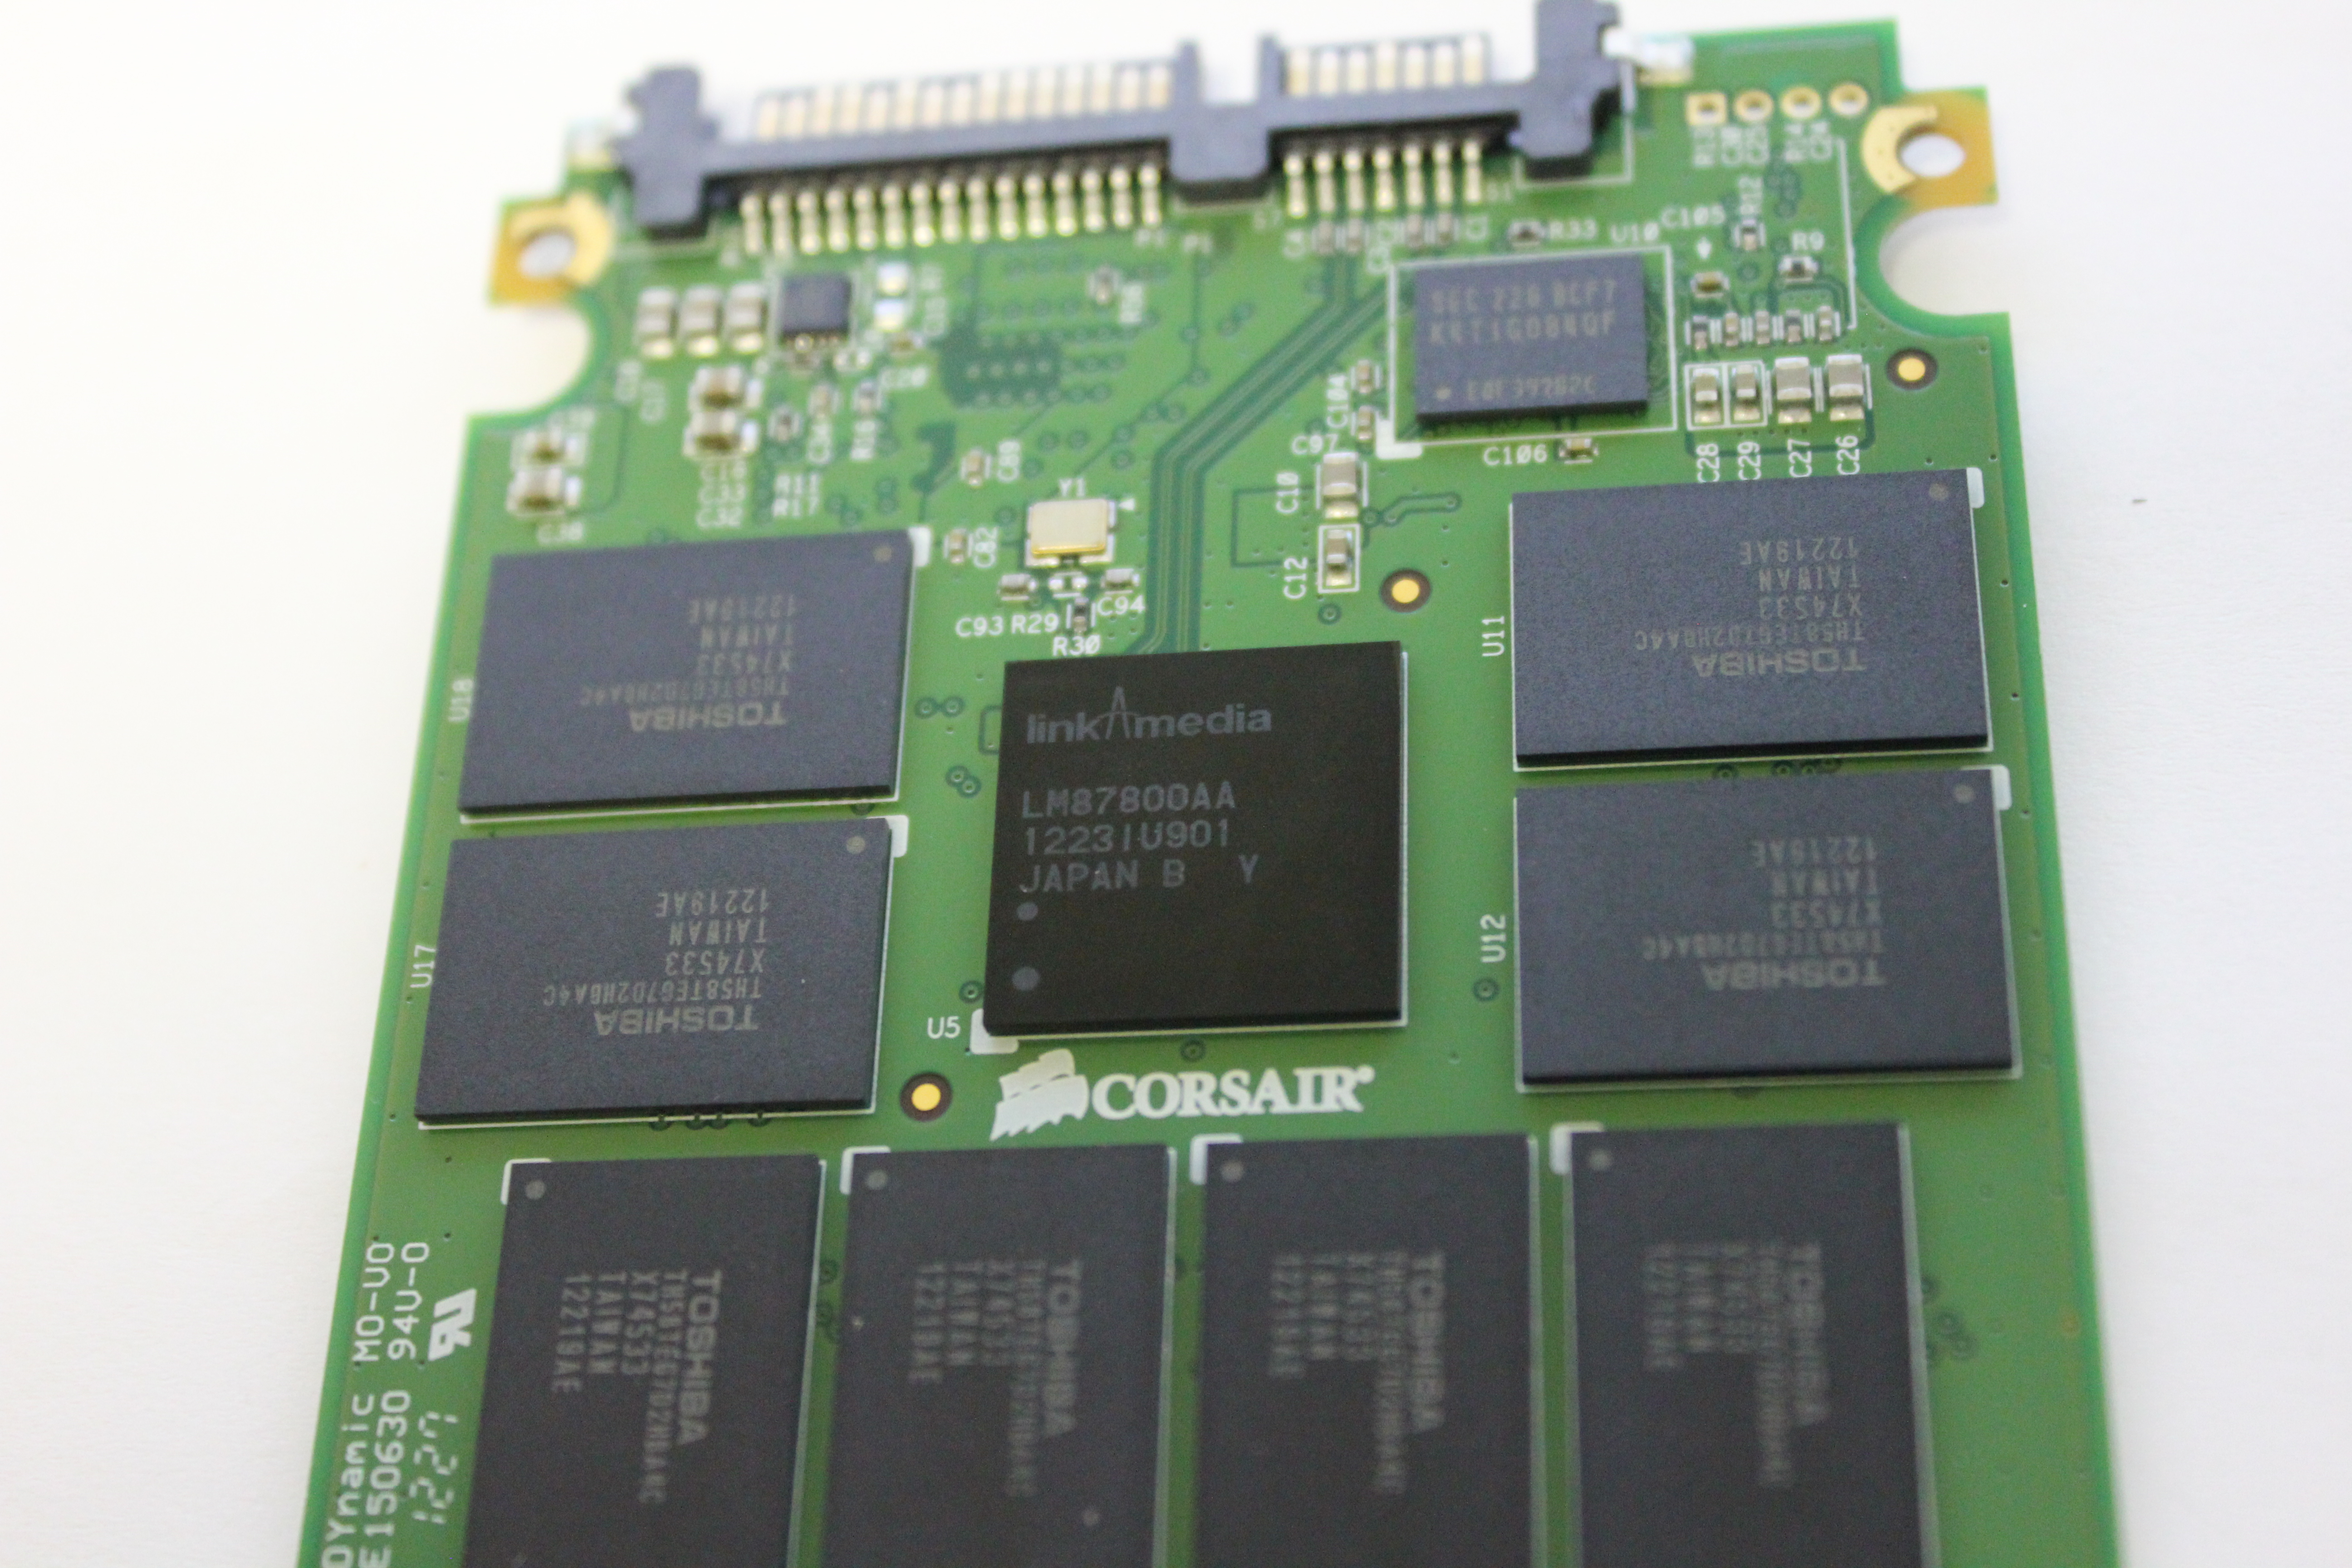
LM87800—The heart of Corsair's Neutron series
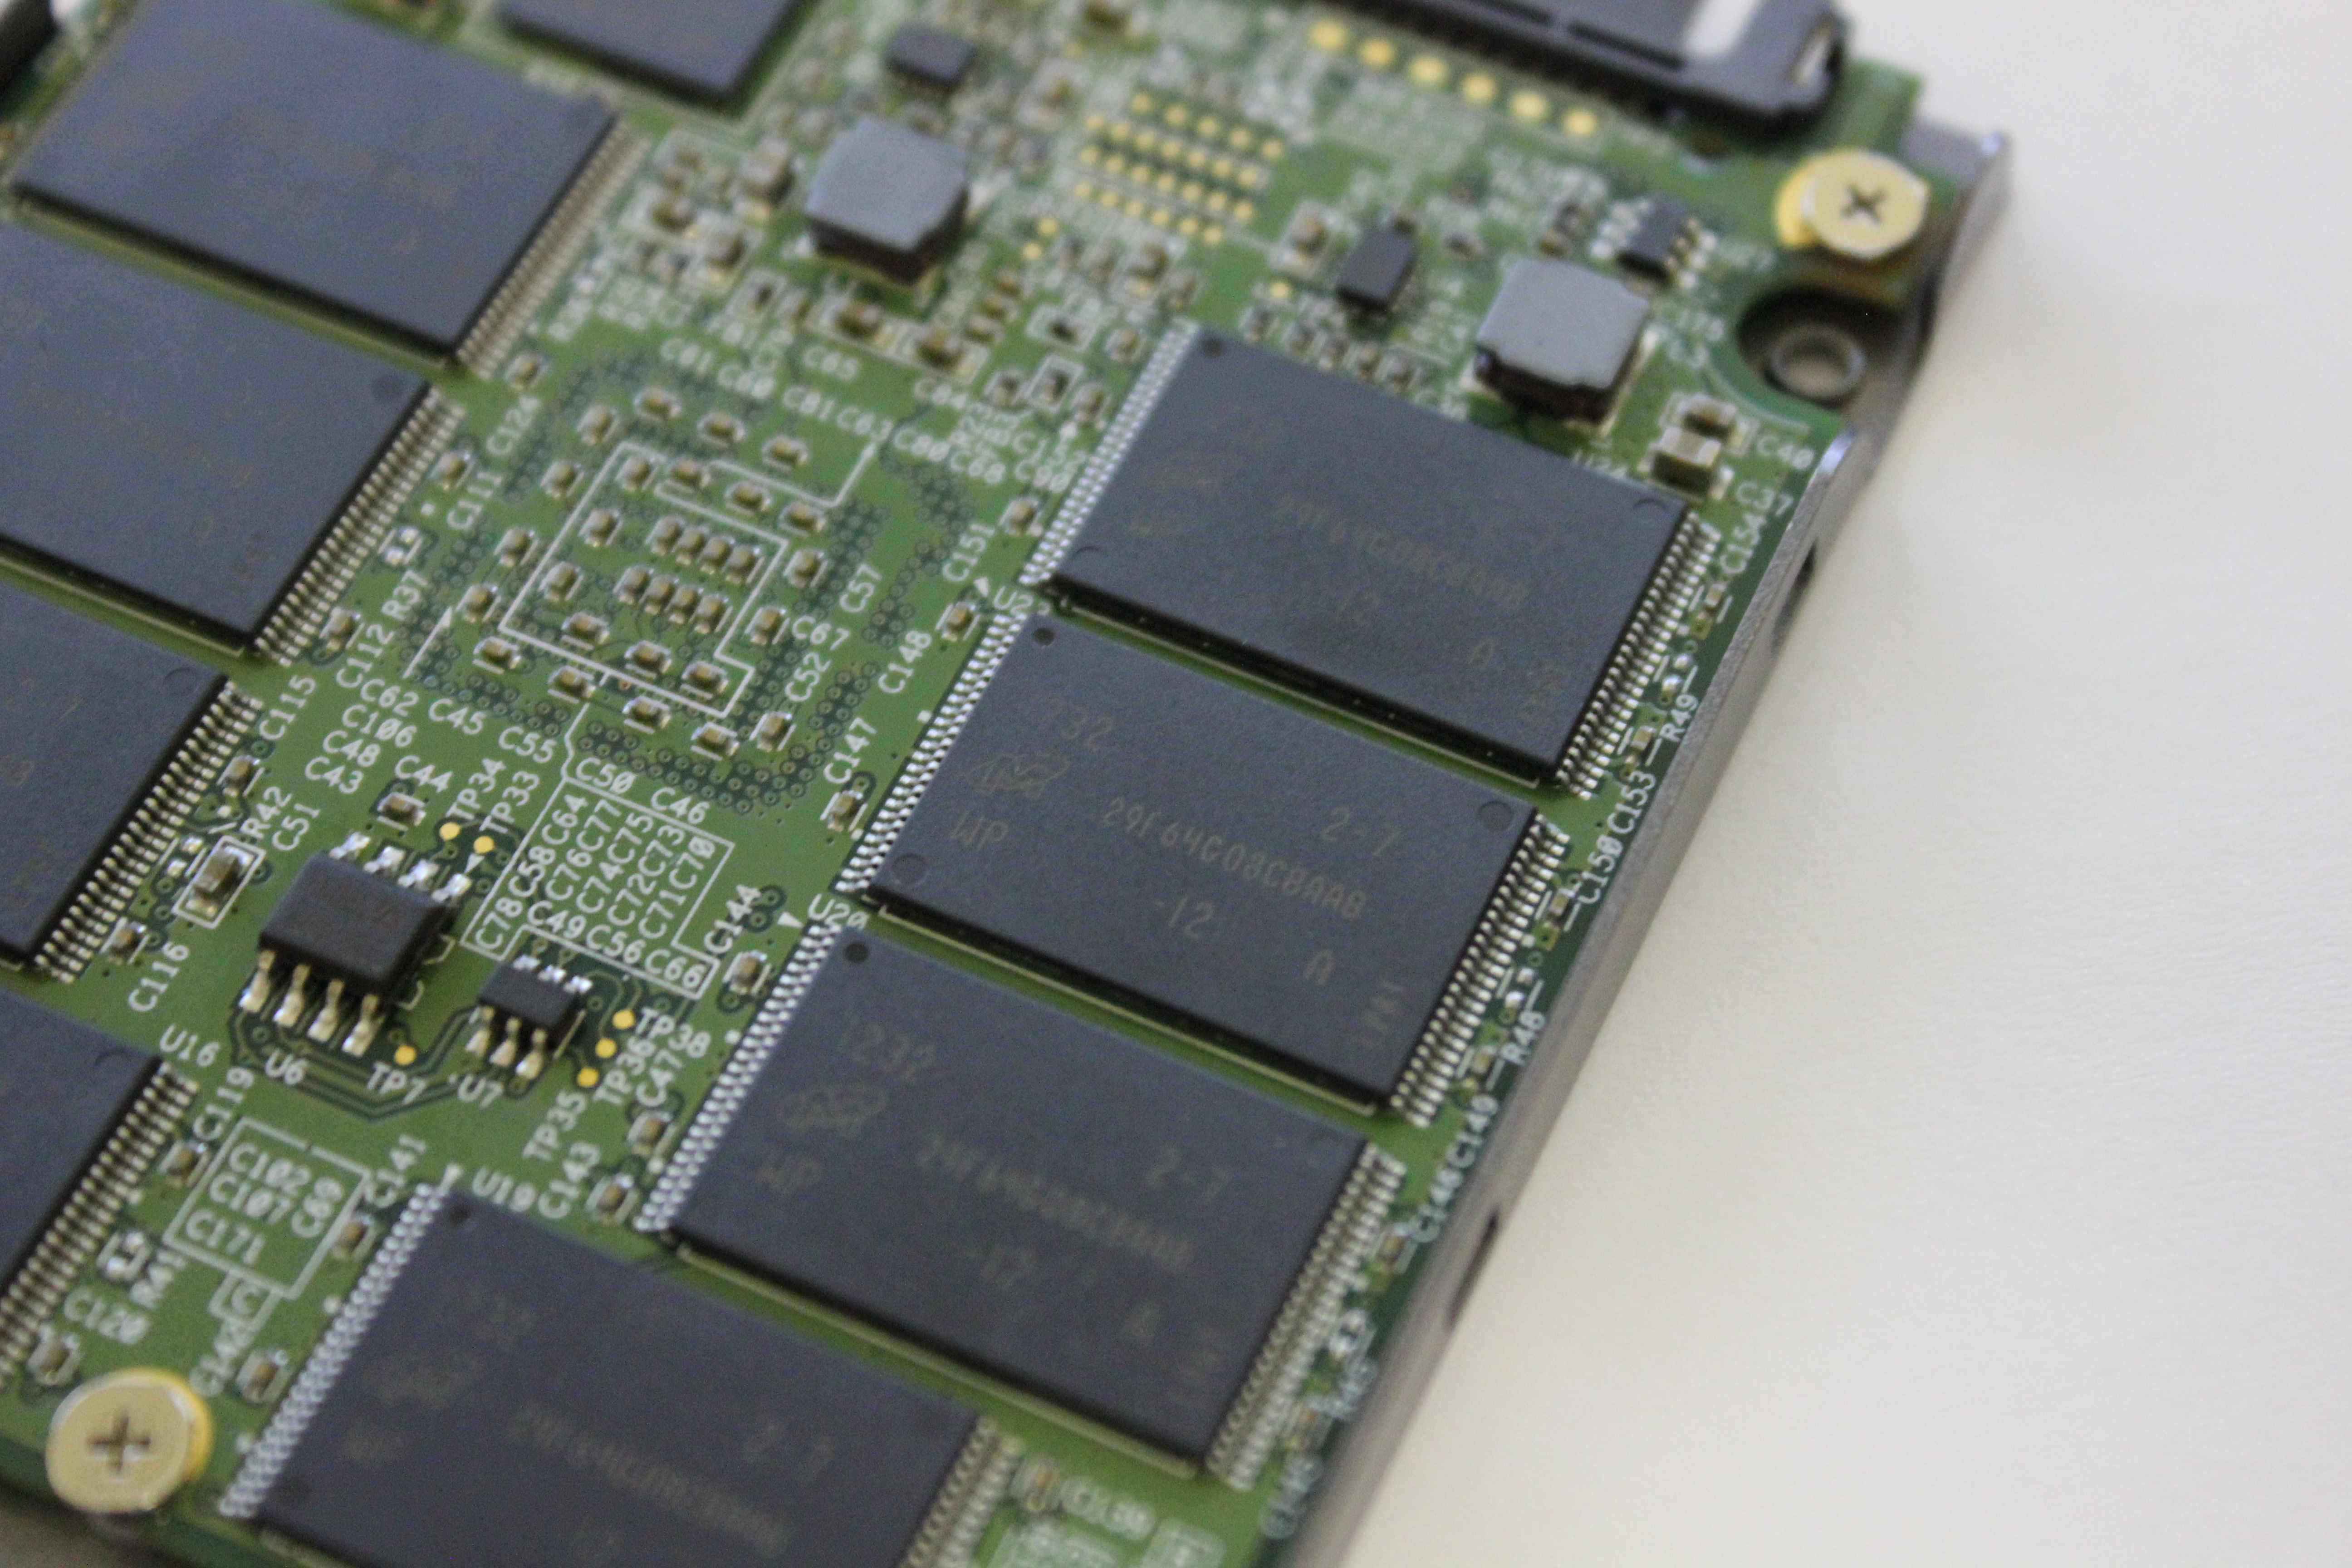
Micron's ONFI NAND in 120GB Neutron
Test System
| CPU |
Intel Core i5-2500K running at 3.3GHz (Turbo and EIST enabled) |
| Motherboard |
AsRock Z68 Pro3 |
| Chipset |
Intel Z68 |
| Chipset Drivers |
Intel 9.1.1.1015 + Intel RST 10.2 |
| Memory | G.Skill RipjawsX DDR3-1600 2 x 4GB (9-9-9-24) |
| Video Card |
XFX AMD Radeon HD 6850 XXX (800MHz core clock; 4.2GHz GDDR5 effective) |
| Video Drivers | AMD Catalyst 10.1 |
| Desktop Resolution | 1920 x 1080 |
| OS | Windows 7 x64 |


44 Comments
View All Comments
Oxford Guy - Sunday, December 23, 2012 - link
Ad hominem much?Plenty of buyers would be interested in knowing that the 830, for instance, tops the charts in terms of power usage under load, particularly given the fact that Samsung's "full specs" advertised number is impossibly low.
People have been tricked by this, which is exactly why Samsung publishes that low number.
Ever heard of laptop battery life? What about heat? I suppose not.
Kristian Vättö - Saturday, December 22, 2012 - link
The figures Samsung reports are with Device Initiated Power Management (DIPM) enabled. That's a feature that is usually only found on laptops but it can be added to desktop systems as well.With DIPM disabled, Samsung rates the idle power at 0.349W, which supports our figures (we got 0.31W).
The same goes for active power, Samsung rates it at 3.55W (sequential write) and 2.87W (4KB random write QD32). The 0.069W figure comes from the average power draw using Mobile Mark 2007, which is something we don't use.
Oxford Guy - Sunday, December 23, 2012 - link
So, in a laptop, the load power for the 830 amazingly plummets from, what 5+ watts, to .13 watts?That's really amazing. I guess the next thing to ask is why these amazing results aren't part of the published charts.
Cold Fussion - Saturday, December 22, 2012 - link
I think the power consumption tests are particularly useless. How come you don't test power consumption under some typical workload and heavy workload so we can see how much energy they use?Kristian Vättö - Sunday, December 23, 2012 - link
Because we don't have the equipment for that. With a standard multimeter we can only record the average peak current, so we have to use an IOmeter test for each number (recording the peak while running e.g. Heavy suite would be useless).Good power measurement equipment can cost thousands of dollars. Ultimately the decision is up to Anand but I don't think he is willing to spend that much money on just one test, especially when it can somewhat be tested with a standard multimeter. Besides, desktop users don't usually care about the power consumption at all, so that is another reason why such investment might not be the most worthwhile.
Oxford Guy - Sunday, December 23, 2012 - link
And we know only desktop users buy SSDs. No one ever buys them for laptops.lmcd - Monday, December 24, 2012 - link
Howabout you buy the equipment for them, if it's such a great investment?Cold Fussion - Tuesday, December 25, 2012 - link
That line of thinking is flawed. If you're only catering to desktop users, why even present the power consumption figures at all? The 3-5w maximum power consumption of an SSD which will largely be idle is not at all significant compared to the 75 watts the cpu is pulling while gaming or the 150watts the gpu is pulling.The tests as they are server no real purpose. It would be like trying to measure power-efficiency of a cpu purely by it's maximum power consumption. I don't believe a basic datalogger is going to run into the 1000s.
Kristian Vättö - Tuesday, December 25, 2012 - link
I didn't say we only cater desktop users, but the fact is that some of our readers are desktop users and hence don't care about the power consumption tests. It's harder to justify buying expensive equipment when some will not be interested in the tests.Don't get me wrong, I would buy the equipment in a heartbeat if someone gave me the money. However, I'm not the one pulling the strings on that. If you have suggestions on affordable dataloggers, feel free to post them. All I know is that the tool that was used in the Clover Trail efficiency article costs around $3000.
Cold Fussion - Tuesday, December 25, 2012 - link
But it doesn't cater to mobile users because the data provided is simply not of any real use. I can go to my local retail electronics store and buy a data-logging multimeter for $150-$250 AUD, I am almost certain that you can purchase one cheaper than that in the US from a retail outlet or online.