Corsair Neutron & Neutron GTX: All Capacities Tested
by Kristian Vättö on December 19, 2012 1:10 PM ESTPerformance Consistency
If you read our Exploring the Relationship Between Spare Area and Performance Consistency in Modern SSDs article, you have seen the performance consistency data for Neutron already and the data here should be nothing new. However, because we didn't have any performance consistency results in our initial Neutron review, I wanted to focus on it here.
We started paying attention to performance consistency when Intel launched the DC S3700 because Intel specifically highlighted its low latencies, which translate to consistent performance. Consistency has been a big selling point in the enterprise market for a long time now, but that has not yet transferred to the consumer SSD market. Given LAMD's enterprise focused history, I was eager to find out how the LM87800 would do in this regard.
To generate the data below I took a freshly secure erased SSD and filled it with compressible sequential data (incompressible for Intel SSD 335) . This ensures that all user accessible LBAs have data associated with them. Next I kicked off a 4KB random write workload at a queue depth of 32 using incompressible data. I ran the test for just over half an hour, no where near what we run our steady state tests for but enough to give me a good look at drive behavior once all spare area fills up.
I recorded instantaneous IOPS every second for the duration of the test. I then plotted IOPS vs. time and generated the scatter plots below. Each set of graphs features the same scale. The first two sets use a log scale for easy comparison, while the last set of graphs uses a linear scale that tops out at 40K IOPS for better visualization of differences between drives.
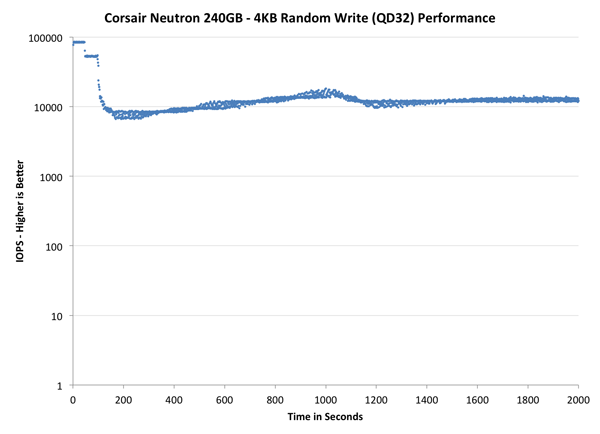
The first set of graphs shows the performance data over the entire 2000 second test period. In these charts you'll notice an early period of very high performance followed by a sharp dropoff. What you're seeing in that case is the drive alllocating new blocks from its spare area, then eventually using up all free blocks and having to perform a read-modify-write for all subsequent writes (write amplification goes up, performance goes down).
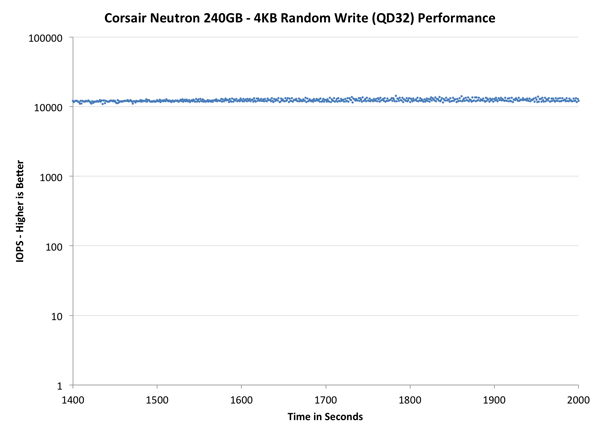
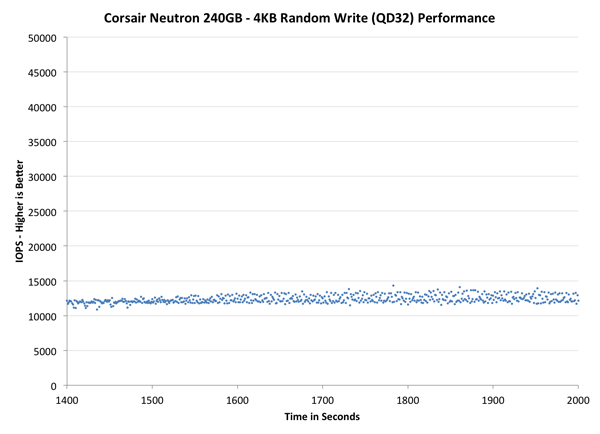
The second set of graphs zooms in to the beginning of steady state operation for the drive (t=1400s). The third set also looks at the beginning of steady state operation but on a linear performance scale. Click the buttons below each graph to switch source data.
The Neutron is extremely consistent. After the first burst, the performance variation is very small compared to for example OCZ Vector and Samsung SSD 840 Pro, although it should be noted that the Neutron comes with 12% over-provisioning by default while Vector and 840 Pro have only 7% of the capacity reserved for OP. The amount of OP can have an enormous effect on consistency but if that extra consistency is only due to the extra OP Corsair and LAMD has set aside, then it's been a great decision. Out of the consumer-grade drives, only Intel SSD 335 is more consistent but SandForce has always performed well when it comes to steady-state performance.
When focusing on the last 10 minutes of the test where most SSDs have reached steady state, the Neutron is exceptional. While all other SSDs in this test including the enterprise focused Intel S3700 have noticeably variation in IOPS, the Neutron does not. The variation is only around 2-3K IOPS, whereas for Intel SSD 335 it's up to 25K IOPS. The steady state performance in general is also great; Vector and 840 Pro have an average IOPS of ~5-8K while the Neutron manages to push 12-13K IOPS. Intel DC S3700 is obviously in its own class but again, keep in mind that it also has significantly more OP than the other SSDs in this test. When the Neutron is given about as much OP as the S3700, they perform about the same.
Neutron's ability to retain performance and consistency over time is definitely appreciated and it's the most consistent consumer-grade SSD at the default OP we have tested. SandForce based SSDs can push much higher peak IOPS but the variation is in the magnitude of tens of thousands of IOPS. While the SSD 335 has higher IOPS on average, it drops below 10K right after 30 minutes of 4KB random writes but the Neutron is able to sustain a throughput of 12-13K throughout the last ten minutes of the test.


44 Comments
View All Comments
nedjinski - Wednesday, December 19, 2012 - link
I wish you could somehow get Mushkin SSD's into the mix :)Kristian Vättö - Thursday, December 20, 2012 - link
I've asked Mushkin for review samples several times but for some unknown reason, they have never sent us any. And yes, I've tried emailing them again and again but I haven't gotten any replies...Mumrik - Thursday, December 20, 2012 - link
That's weirdly worrying.AT isn't exactly a small hardware-grabbing site.
ICBM - Wednesday, December 19, 2012 - link
It was mentioned that the LAMD controller isn't in the same class as Vector/840Pro, however it seems like it only loses a couple of benchmarks. The others it is winning or just slightly behind. So is it really not up to par with OCZ and Samsung? Would the average user, heck scratch that. Would the most avid enthusiast know the difference between an 840 Pro and a Neutron GTX running in their system?Beenthere - Wednesday, December 19, 2012 - link
In actual use no one is likely to be able to tell the difference in performance between a SATA 2 drive compared to a SATA 3, let alone between the recent crop of SATA 3 SSDs.People should do their homework before jumping in to an SSD. If you chose to go forward at least you'll know which drives to definitely avoid and which ones are the cheapest. Don't assume because an SSD is a familair brand name that it is either reliable nor fully compatible because you may be in for quite a rude awakening. It's foolish to pay more based on some perceived benefit in benchmarks when it means nothing in actual use.
Denithor - Thursday, December 20, 2012 - link
This is very true.I switched from a 120GB Intel 320 (SATA 2) to a 180GB Intel 330 (SATA 3) and the only difference I could see/feel was the increased capacity of the new drive. Boot times were nearly identical, apps open at the same speeds, no discernible improvement from the upgrade.
hammer256 - Wednesday, December 19, 2012 - link
Those consistency results are pretty remarkable. From newegg reviews, however, it appears to have a bimodal distribution of 5's and 1's, but the sample size is pretty small. Still, I wonder how good their QC is...skytrench - Thursday, December 20, 2012 - link
Not really, the consistency tests on a 100% full and 100% fragmented drive with nonstop 4k random writes, doesn't reflect reality. You wouldn't even allow your ZFS filesystem to reach that state! Some better test should be devised.nushydude - Thursday, December 20, 2012 - link
which SSD to get strictly for OS, applications and games? i think Neutron GTX is too much because i won't be writing much data. a Samsung 840 should suffice? i want better performance than a 120GB Kingston HyperX (original one) btw.nathanddrews - Thursday, December 20, 2012 - link
Simple, use the light workload storage benchmarks and select any drive that performs better than your current SSD.I'll even be really nice and provide you with a link. :-)
http://www.anandtech.com/bench/SSD/269