AMD A10-5800K & A8-5600K Review: Trinity on the Desktop, Part 2
by Anand Lal Shimpi on October 2, 2012 1:45 AM ESTContent Creation Performance
Adobe Photoshop CS4
To measure performance under Photoshop CS4 we turn to the Retouch Artists’ Speed Test. The test does basic photo editing; there are a couple of color space conversions, many layer creations, color curve adjustment, image and canvas size adjustment, unsharp mask, and finally a gaussian blur performed on the entire image.
The whole process is timed and thanks to the use of Intel's X25-M SSD as our test bed hard drive, performance is far more predictable than back when we used to test on mechanical disks.
Time is reported in seconds and the lower numbers mean better performance. The test is multithreaded and can hit all four cores in a quad-core machine.
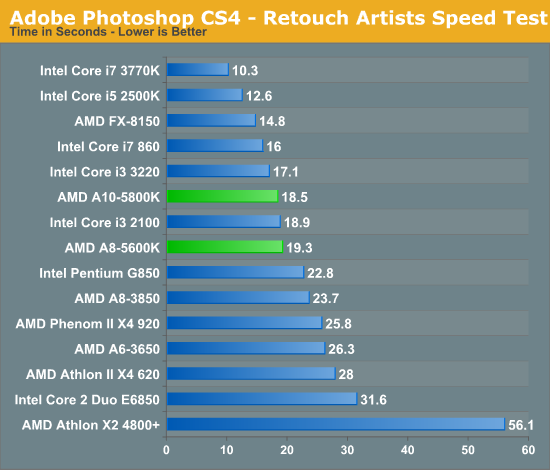
Our Photoshop workload still runs better on Intel hardware, but the gap in performance between the 5800K and 3220 is smaller than it was between the FX-8150 and 2500K last year. While Bulldozer was pretty much unrecommendable, Trinity approaches tradeoff territory.
3dsmax 9 & POV-ray
Today's desktop processors are more than fast enough to do professional level 3D rendering at home. To look at performance under 3dsmax we ran the SPECapc 3dsmax 8 benchmark (only the CPU rendering tests) under 3dsmax 9 SP1. The results reported are the rendering composite scores.
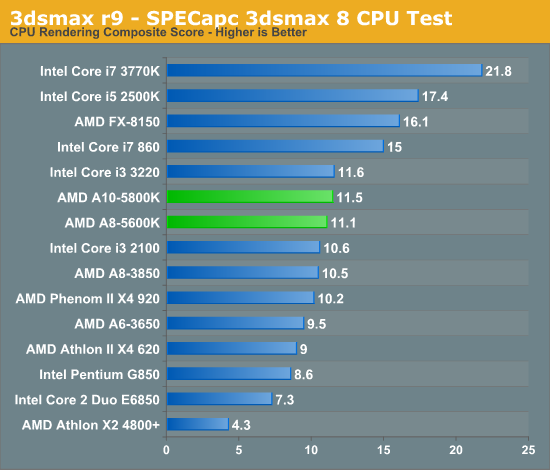
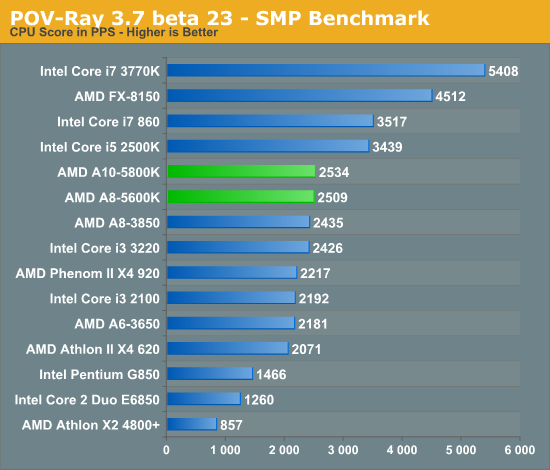
Once again in a heavily threaded FP benchmark, the A10 and Core i3 perform very similarly. POV-Ray is another example of this below:
File Compression/Decompression Performance
Par2 is an application used for reconstructing downloaded archives. It can generate parity data from a given archive and later use it to recover the archive
Chuchusoft took the source code of par2cmdline 0.4 and parallelized it using Intel’s Threading Building Blocks 2.1. The result is a version of par2cmdline that can spawn multiple threads to repair par2 archives. For this test we took a 708MB archive, corrupted nearly 60MB of it, and used the multithreaded par2cmdline to recover it. The scores reported are the repair and recover time in seconds.
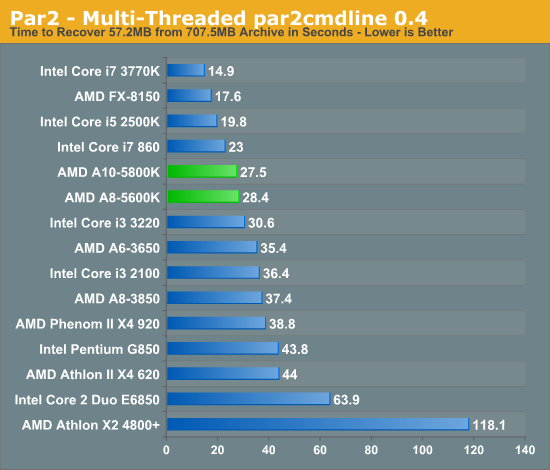
Our multithreaded Par2 recovery test shows AMD with a small advantage over the Core i3 3220, although it obviously can't touch any of the more expensive quad-core parts.
Excel Math Performance
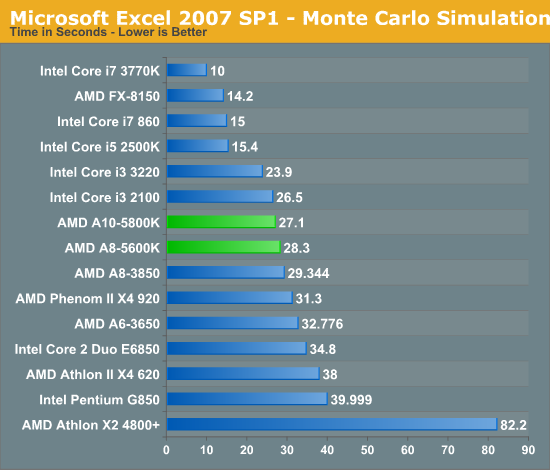
Not all heavily threaded FP applications are easy wins for AMD. In our Monte Carlo simulation benchmark the 3220 manages a decent lead over the A10-5800K.
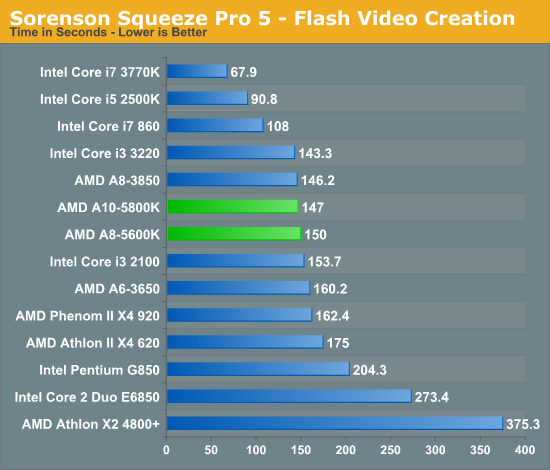
Our old Sorenson Squeeze test is one area where we see a slight regression compared to Llano. Like I mentioned earlier, this isn't super common but it does happen from time to time given the dramatic architecture difference between Llano and Trinity.


178 Comments
View All Comments
Aone - Wednesday, October 3, 2012 - link
Who being in his right buys high-end discrete GPU for cheap CPU or APU?Plus, those who buy cheap CPUs usually don't have money for high-end discrete GPU.
Gaugamela - Wednesday, October 3, 2012 - link
Here are benchmarks that test the importance of faster RAM in these APUs. The difference in performance is astonishing. http://hexus.net/tech/reviews/cpu/46073-amd-a10-58...By overclocking and using 2133Mhz RAM the A10-5800 can get approximately a 30% increase in 3DMark and some games.
These Trinity APUs seem to be really interesting to tinker with.
creed3020 - Wednesday, October 3, 2012 - link
Thanks so much for posting that. I've been looking for this exact testing of Trinity. AT did this previously with Llano but forgot this crucial test with Trinity.It really helps system builders to set expectations for performance if a client doesn't want to pay for faster memory, or if they do want more performance we can quantify how much an improvement faster memory will have.
mikato - Wednesday, October 3, 2012 - link
Holy molyvozmem - Wednesday, October 3, 2012 - link
Keep encouraging AMD, guys.rarson - Wednesday, October 3, 2012 - link
Why in the world did you not mention which video card you were using on this page? I see that it's mentioned in the test bed, but why the heck do I have to go back and check that when you could have easily mentioned it on the discrete test page?Also, why are you using a 5870 with this? Who the hell is going to pair a new A8 or A10 Trinity with a 5870? That's completely illogical. Couldn't you have tried something newer, perhaps something within the same architecture? Extremely puzzling.
etamin - Wednesday, October 3, 2012 - link
And why was an FX-8150 thrown into the DISCRETE PROCESSOR GRAPHICS benchmark?Hardcore69 - Wednesday, October 3, 2012 - link
HA! Glad I went with an i3 3220 for this office box. Look at the power consumption at load, look at the single threaded benchmarks, even look at the multi threaded benchmarks. AMD is crap. It still hasn't caught up. And there are very few upgrade options compared to Intel. If you want to play games, a dedicated GPU is still vastly better. For other basic tasks, FAIL.rarson - Wednesday, October 3, 2012 - link
You paid more money.They're called trade-offs. That's reality.
Nil Einne - Friday, October 5, 2012 - link
Has anyone come across real world power consumption figures for either the A8-5500 vs A8-5600K or the A10-5700 vs A10-5800K. These have different TDPs, 65W vs 100W and slightly different clocks. But I'm wondering whether the K ones are really that bad in general or it's partially that they wanted more headroom since the K ones are to some extent designed to be overclocked. Of course the different ratings means that you may get unlucky and get a fairly high consumption K processor because of binning but still may be relevent. I'm somewhat out of date and not familiar with how turbo works, but I'm guessing the higher binning means it will stay at turbo for longer so a proper test should also try limiting the K to be the same as the non K just to see if that's the primary reason for any differences. (Ideally also limit the frequencies.)Most reviews including this one seem to be of the Ks I presume because that's what AMD sent out for testing.
Cheers