NVIDIA GeForce GTX 690 Review: Ultra Expensive, Ultra Rare, Ultra Fast
by Ryan Smith on May 3, 2012 9:00 AM ESTOverclocked: Power, Temperature, & Noise
Our final task is our look at GTX 690’s overclocking capabilities. NVIDIA has told us that with GTX 690 they weren’t just looking to duplicate GTX 680 SLI’s performance, but also its overclocking capabilities. This is quite the lofty goal, since with GTX 690 NVIDIA is effectively packing 2 680s into the same amount of space, leaving far less space for VRM circuitry and trace routing.
| GeForce 600 Series Overclocking | ||||
| GTX 690 | GTX 680 | |||
| Shipping Core Clock | 915MHz | 1006MHz | ||
| Shipping Max Boost Clock | 1058MHz | 1110MHz | ||
| Shipping Memory Clock | 6GHz | 6GHz | ||
| Shipping Max Boost Voltage | 1.175v | 1.175v | ||
| Overclock Core Clock | 1040MHz | 1106MHz | ||
| Overclock Max Boost Clock | 1183MHz | 1210MHz | ||
| Overclock Memory Clock | 7GHz | 6.5GHz | ||
| Overclock Max Boost Voltage | 1.175v | 1.175v | ||
In practice NVIDIA has not quite kept up with GTX 680, and in other ways completely exceeded it. When it comes to the core clock we didn’t quite reach parity with our reference GTX 680; the GTX 680’s highest boost clock bin could hit 1210MHz, while the GTX 690’s highest boost clock bin topped out at 1183MHz, some 27MHz (2%) slower.
On the other hand, our memory overclock is so high as to be within the “this doesn’t seem physically possible” range. As we have discussed time and time again, GDDR5 memory busses are difficult to run at high clocks on a good day, never mind a bad day. With GF110 NVIDIA couldn’t get too far past 4GHz, and even with GTX 680 NVIDIA was only shipping at 6GHz.
It would appear that no one has told NVIDIA’s engineers that 7GHz is supposed to be impossible, and as a result they’ve gone and done the unthinkable. Some of this is certainly down to the luck of the draw, but it doesn’t change the fact that our GTX 690 passed every last stability test we could throw at it at 7GHz. And what makes this particularly interesting is the difference between the GTX 680 and the GTX 690 – both are equipped with 6GHz GDDR5 RAM, but while the GTX 680 is equipped with Hynix the GTX 690 is equipped with Samsung. Perhaps the key to all of this is the Samsung RAM?
In any case, our final result was a +125MHz core clock offset and a +1000MHz memory clock offset, which translates into a base clock of 1040MHz, a max boost clock of 1183MHz, and a memory clock of 7GHz. This represents a 12%-14% core overclock and a 17% memory overclock, which is going to be enough to put quite the pep in the GTX 690’s step.
As always we’re going to start our look at overclocking in reverse, beginning with power, temperature, and noise. For the purpose of our testing we’ve tested our GTX 690 at two different settings: at stock clocks with the power target set to 135% (GTX 690 PT), and with our custom overclock alongside the same 135% power target (GTX 690 OC). This allows us to look at both full overclocking and the safer option of merely maxing out the boost clocks for all they’re worth.
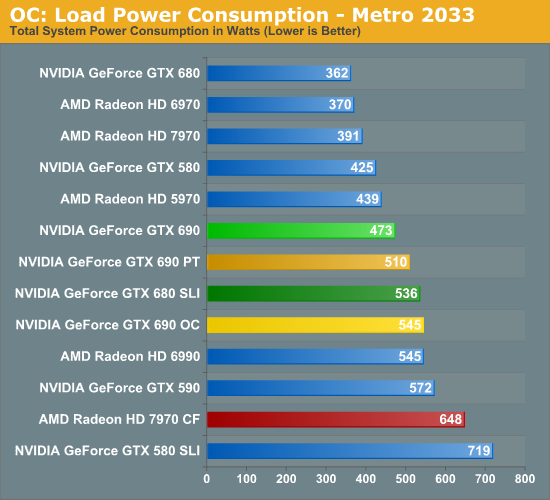
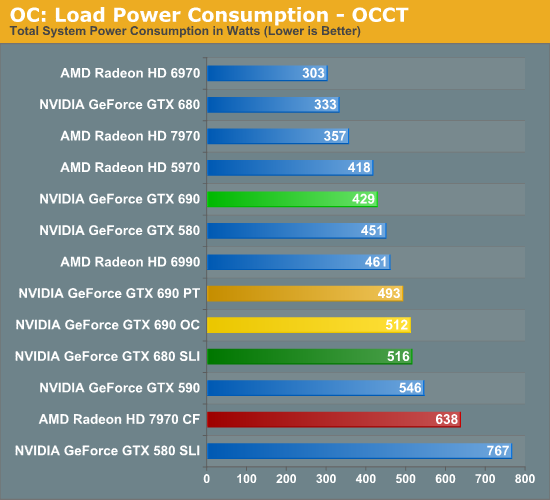
As expected, merely increasing the power target to 135% was enough to increase the GTX 690’s power consumption, though overclocking further adds to that. Even with the power target increase however, the power consumption at the wall for the GTX 690 is still lower than the GTX 680 SLI by over 20W, which is quite impressive. As we’ll see in our section on performance this is more than enough to erase the GTX 690’s performance gap, meaning at this point its still consuming less power than the GTX 680 SLI while offering better performance than its dual-card cousin.
It’s only after outright overclocking that we finally see power consumption equalize with the GTX 680 SLI. The overclocked GTX 690 is within 10W of the GTX 680 SLI, though as we’ll see the performance is notably higher.
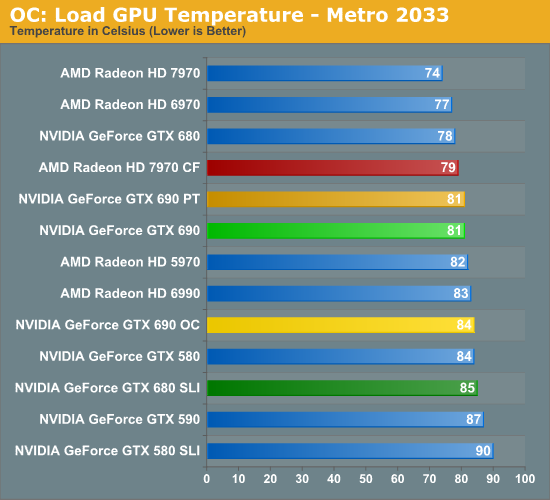
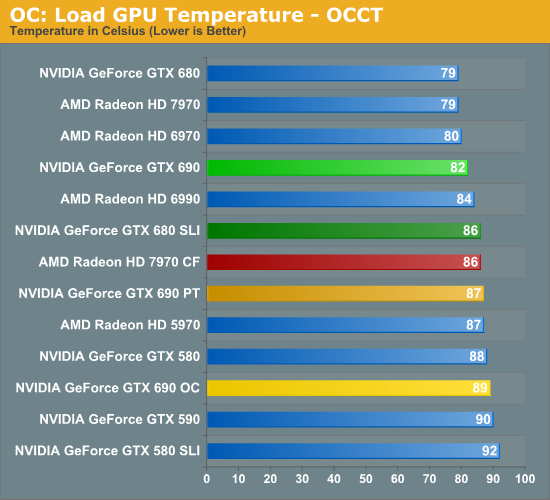
What does playing with clocks and the power target do to temperatures? The impact isn’t particularly bad, though we’re definitely reaching the highest temperatures we really want to hit. For the GTX 690 PT things are actually quite good under Metro, with the temperature not budging an inch even with the higher power consumption. Under OCCT however temperatures have risen 5C to 87C. Meanwhile the GTX 690 OC reaches 84C under Metro and a toasty 89C under Metro. These should be safe temperatures, but I would not want to cross 90C for any extended period of time.
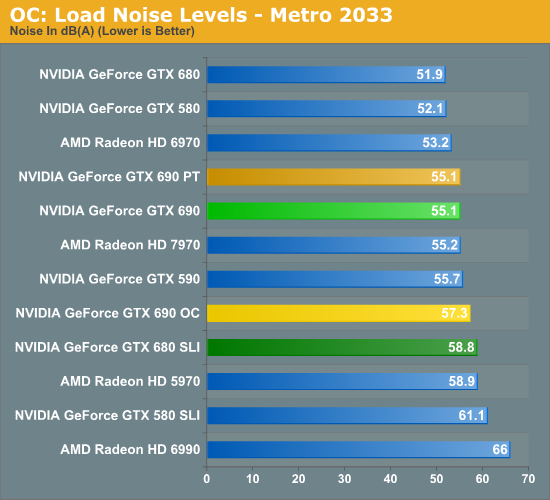
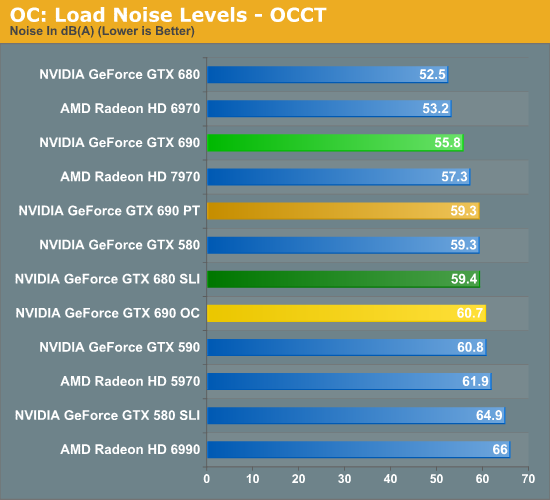
Finally we have load noise. Unsurprisingly, because load temperatures did not go up for the GTX 690 PT under Metro load noise has not gone up either. On the other hand load noise under OCCT has gone up 3.5dB, making the GTX 690 PT just as loud as our GTX 680 SLI in its adjacent configuration. In practice the noise impact from raising the power target is going trend closer to Metro than OCCT, but Metro is likely an overly optimistic scenario; there’s going to be at least a small increase in noise here.
The GTX 690 OC meanwhile approaches the noise level of the GTX 680 SLI under Metro, and shoots past it under OCCT. Considering the performance payoff some users will no doubt find this worth the noise, but it should be clear that overclocking like this means sacrificing the stock GTX 690’s quietness.


200 Comments
View All Comments
CeriseCogburn - Sunday, May 6, 2012 - link
It's a very pertinent topic because despite the protestations the vast majority of readers are likely to have a 1080p monitor, and apparently they all have amnesia as well since this came up in a very, very recent article - one of the last few on the video cards - where it was even pointed out by Anand himself that one should extrapolate the fps data with the 11% pixel difference, something every last one of you either never read or completely forgot or conveniently omitted.Unfortunately Anand isn't correct, period. He should know it, but of course has to have an answer for the complainers - so he gave one.
What should be clear, even by just looking at the 1920X benches here is that below that resolutin and above it don't always jibe with it - and personally I've noticed nVidia has issues with 1600X1200.
So, all the hundreds of readers with 1080p monitors can thank me deep down in their hearts, as they now know Nvidia is supreme at that resolution, by 17%+ on average, more so than at 1200p, and thus "saving money" on an amd card using this sites 1920 1200p stats is for many, incorrect.
Makaveli - Thursday, May 3, 2012 - link
no one is mad or raging I think most are just amused at your stupidity! and sad attempt at trolling.Trololol
CeriseCogburn - Sunday, May 6, 2012 - link
Yet my point is absolutely prescient and helpful to anyone whom isn't a raging fanboy fool.Doesn't appear you've risen above that category.
InsaneScientist - Sunday, May 6, 2012 - link
And yet they specifically called out the fact that the patch broke performance on nVidia cards, went out of their way to state what performance was like before the patch (which is clearly better than any of the other cards), and finally stated that they're pretty sure that the game is at fault, not nVidia or their drivers...Yeah, they really must have it out for nVidia... *sigh*
CeriseCogburn - Sunday, May 6, 2012 - link
Except in the 680 tests all you fools ignored S2TW, which I had to repeatedly point out was the hardest game in the bunch, not Crysis or M2033 - over and over again I had to tell all the fools blabbering, and now suddenly the game is "broken". ROFL - it's beyond amazing.CeriseCogburn - Sunday, May 6, 2012 - link
Oh look it's not broken, TPU can handle it with nearly 100% single card SLI scaling with the 690http://www.techpowerup.com/reviews/NVIDIA/GeForce_...
Gee I guess it was "harder" here.
blackened23 - Thursday, May 3, 2012 - link
you appear to be using an old version of Batman without the latest patch.blackened23 - Thursday, May 3, 2012 - link
http://www.computerandvideogames.com/340746/batman...You are using an outdated version, the newest version released in March enhances both SLI and CF performance.
Ryan Smith - Thursday, May 3, 2012 - link
We're on the latest version. I triple checked.blackened23 - Thursday, May 3, 2012 - link
Are you using the Steam version? Your results differ from that of HardOCP, hardwareheaven, and hardwarecanucks. They get scaling you don't. Your version should be dated March 2012, thats when the patch was released.