AMD Launches Radeon 7700M, 7800M, and 7900M Mobile GPUs
by Jarred Walton on April 24, 2012 4:25 AM EST- Posted in
- Laptops
- AMD
- GCN
- Radeon HD 7000
- GPUs
AMD Launches Radeon Mobility 7700M, 7800M, and 7900M GPUs
Late last year, AMD pushed out the first of their Southern Islands GPUs for the desktop, the HD 7970. Around the same time, AMD also announced their first 7000M mobile GPUs. Since then, AMD has gone on to launch the HD 7950, the HD 7750/7770, and the HD 7850/7870. Meanwhile, on the mobile front we’ve had to sit back and wait…and wait. Today, the waiting ends, at least for one of the parts: the HD 7970M is now shipping in select notebooks, and the other GPUs will likely start showing up in other laptops and notebooks over the coming weeks.

As is customary for AMD and NVIDIA, new GPUs debut on the desktop, and after a while they trickle down into the mobile world. NVIDIA actually pulled a fast one with GK107 actually coming out ahead of the desktop GK104, which may be a sign of the changing times, but AMD’s GCN is sticking with the traditional route of using lower clocked power optimized versions of already launched desktop chips for their mobile parts. Not that there’s anything wrong with that from a business standpoint, but it does make laptop users feel like second class citizens. Before we continue the discussion, let’s list the specs.
| AMD Radeon HD 7900M, 7800M, and 7700M | |||
| Radeon HD 7900M | Radeon HD 7800M | Radeon HD 7700M | |
| Core Name | Wimbledon | Heathrow | Chelsea |
| Stream Processors | 1280 | 640 | 512 |
| Texture Units | 80 | 40 | 32 |
| ROPs | 32 | 16 | 16 |
| Z/Stencil | 128 | 64 | 64 |
| L2 Cache | 512KB | 512KB | 512KB |
| Core Clock | 850MHz | 800MHz | 675MHz |
| Memory Clock | 4.8GHz | 4.0GHz | 4.0GHz |
| Memory Type | 2GB GDDR5 | 2GB GDDR5 | 2GB GDDR5 |
| Memory Bus Width | 256-bit | 128-bit | 128-bit |
| Memory Bandwidth | 153.6GB/s | 64GB/s | 64GB/s |
| PCI Express | 3.0 | 3.0 | 2.1 |
Starting at the high end, AMD will have the 7900M series. Note that there will be more than one part for each family, but AMD is currently providing the configuration for the highest performance parts in each category. At the top, the HD 7970M uses a fully enabled Pitcairn core. The GPU clock is 850MHz compared to 1000MHz (stock) on the desktop HD 7870, but surprisingly AMD is going whole hog on the RAM and featuring 2GB of 4.8GHz GDDR5. That makes the 96GB/s bandwidth of NVIDIA’s GTX 580M/675M positively pale in comparison, and we’d wager the GPU performance will easily reclaim the mobile performance crown—at least until NVIDIA launches the inevitable GTX 680M, but we don’t know when that will be. Going by the core clocks, the HD 7970M should be about 15% slower than the HD 7870, and given the fact that no consumer laptops have yet shipped with an LCD resolution above 1920x1200, you can look at our HD 7870 benchmarks and subtract 15% to get a pretty good idea of how the HD 7970M will perform.
AMD was also "kind" enough to provide a comparison slide with their own benchmarks, showing performance relative to the HD 6990M. As always, take these graphs for what they're worth:
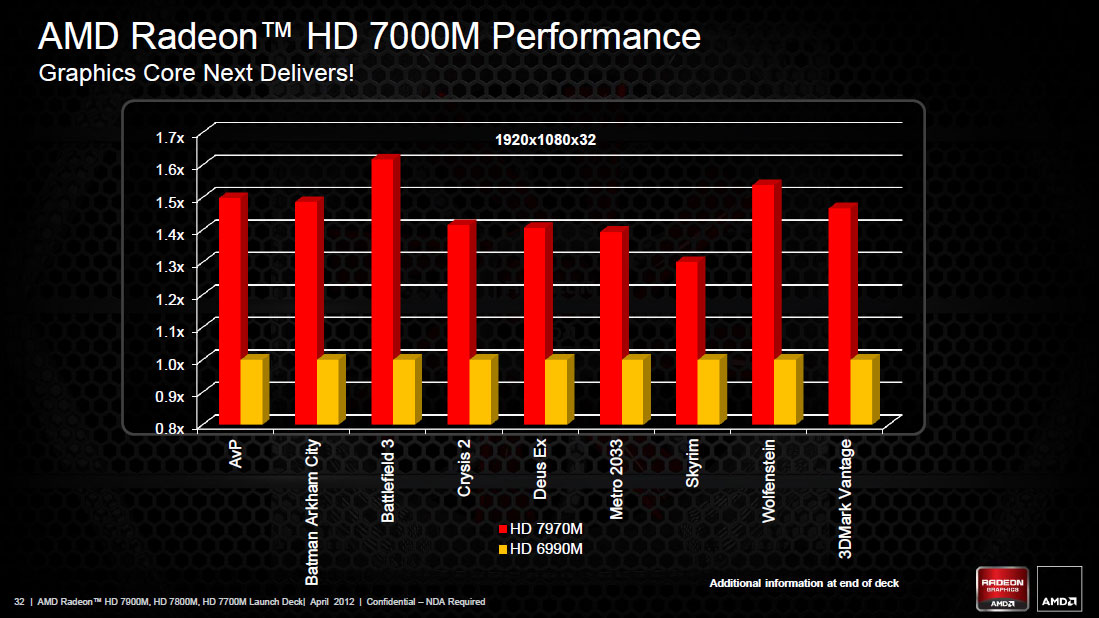
HD 6990M was certainly no slouch as far as mobile gaming is concerned; you can see how it stacked up against the GTX 580M in our Alienware M18x head-to-head in both single- and dual-GPU configurations. The quick summary is that across the eight games we tested last year, SLI GTX 580M averaged out to approximately 8% faster than CrossFire HD 6990M; for single GPUs, the result is more in NVIDIA’s favor: the GTX 580M was 8% faster at our Ultra settings, and 17% faster at our High settings. Assuming AMD’s numbers are correct (and given the amount of memory bandwidth and GPU cores we’re looking at, we see no reason why they wouldn’t be), it looks like HD 7970M will be around 45% faster than the HD 6990M on average, or about 25% faster than a single GTX 580M.
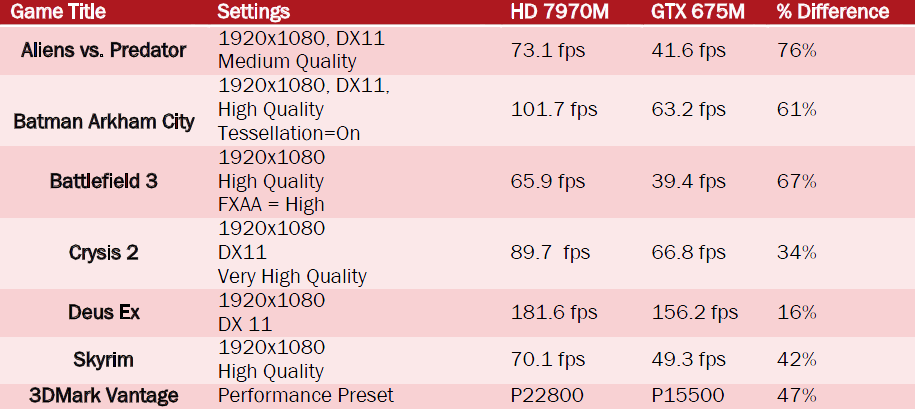
AMD also presented some data showing their estimate of performance results for HD 7970M vs. GTX 675M, which you can see below, though it appears that information was simulated using desktop hardware (Core i7-2600K) and while the numbers are likely accurate, the selection of games and the chosen settings could be debated. AMD obviously isn't an unbiased review source. Now we can wait for NVIDIA’s inevitable response with a high-end mobile Kepler.
The other two GPUs are an interesting pair. Both use the Cape Verde core, but where the 7800M is a fully enabled 640 core part, the 7700M disables a couple compute clusters and ends up with 512 cores and 32 texture units. AMD also clocks the 7700M lower, most likely to hit lower TDP targets for laptops rather than because of inherent limitations with the chips. Compared to the desktop parts, the (presumed) HD 7870M will run the core at 800MHz vs. 1000MHz on the HD 7770 GHz Edition, and memory is at 4GHz effective compared to 4.5GHz on the desktop parts. For the (again presumed) HD 7770M, the core will run at 675MHz compared to 800MHz on the desktop HD 7750.
There’s one other big difference between the HD 7700M and the HD 7800M: PCI Express 3.0 support will not be present on the 7700M. Before anyone gets too upset, we need to put things in perspective. First, while PCIe 3.0 has improved performance with HD 7970 on the desktop, for the HD 7700M we’re looking at a part that has only one fourth the compute power. Second, remember what we just said about HD 7700M being clocked lower most likely in order to hit TDP targets? We asked AMD about the removal of PCIe 3.0 support (given both families use Cape Verde, the potential is certainly there), and their response confirmed our suspicions: “The Cape Verde die itself supports PCIe 3; the reason we chose not to include it in our 7700M is because it mostly targets platforms where power saving is king, and the sacrifice (though not huge) in that regard would not have been justified by the small performance gain going from gen 2 to gen 3.”
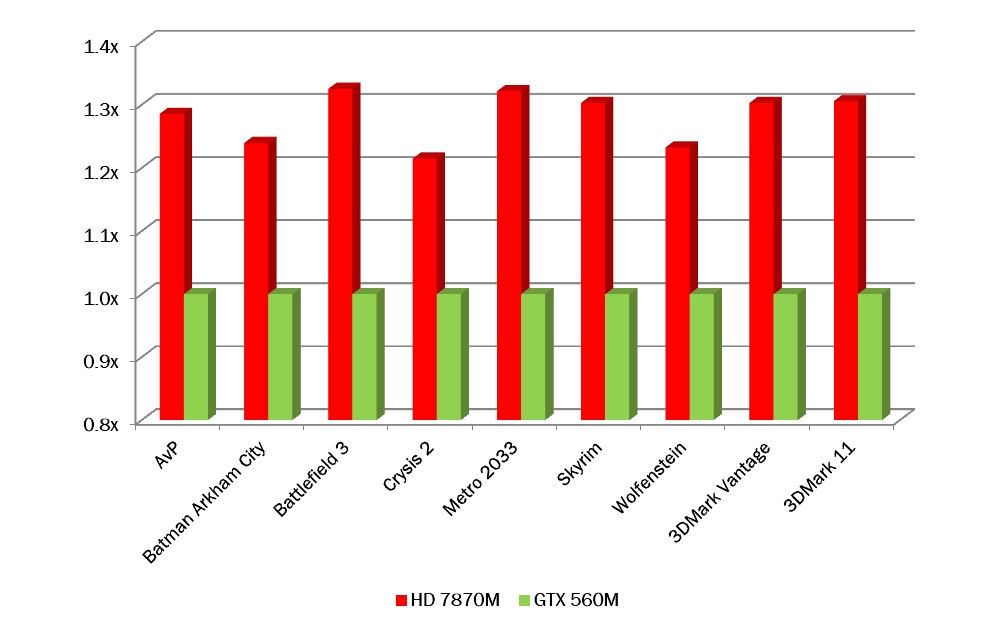
And for the curious, once again AMD provided an estimate of performance for the 7870M vs. the GTX 560M (simulated using desktop hardware). Results are at 1920x1080/1920x1200 with a variety of quality settings, so take the following with a grain of salt.


50 Comments
View All Comments
shaw - Wednesday, April 25, 2012 - link
These charts always cracks me up and I laugh. <AMD Chart>We are more better x2! They are less better x3! Do the math!</AMD Chart>It's like, with consoles the bit wars tag line has died out, but its PC equivalent has never stopped.
JarredWalton - Wednesday, April 25, 2012 - link
Except the charts clearly show the 0.8x to 1.6x times faster labels, so the only people who have problems are those who don't know how to read a graph. Anyone that glances at a graph and thinks, "Wow, the red bar is four times as big as the green bar!" without actually looking at what the bars mean deserves exactly what they get.erple2 - Wednesday, April 25, 2012 - link
Now Jarred.Graphing 101 tells us to make clear graphs. The lines marked the way that are listed are clearly done strictly as marketing - it "cheapens" the graph completely by not having a common datum.
The graph is supposed to convey 2 pieces of information - a useful representation of the relative performance of the product, and on more careful examination, the exact differences.
Why bother putting a bar graph in it if you're not actually making a bar graph? That's the problem. You're using a tool designed to graphically convey useful information in an at best misleading and, at worst negligent fashion.
Perhaps the data visualization perfectionist in me cringes every time I see a poor data representation. Either way, I can see that it's just plain wrong.
UltraTech79 - Wednesday, April 25, 2012 - link
What kind of shitty attitude is that? Are you seriously defending misleading graphs based on "you should know better, and if not then you deserve to be screwed" ?You should work for the credit card industry with crappy ethics like that.
JarredWalton - Thursday, April 26, 2012 - link
As I have said twice in the threads, these are AMD's graphs, showing their numbers, and everyone reading this article should be absolutely aware of that. RTFA. Don't tell me how to make graphs when these aren't my graphs, because I certainly wouldn't do a graph like this. I'm likewise not putting the AnandTech graphing style on display, because then the casual reader might think we actually ran some tests. I'm not sure how I can be any more clear than that.With that said, the graphs are still clear about what they show and you all know exactly what they mean. The graphs come from a marketing department, and marketing loves to try and make things look better. AMD, Intel, and NVIDIA all put out charts like this, and it's allowed because the necessary information to correctly interpret the results is right there in the graphs. It is slightly misleading, but only to people that don't care enough to use their brain cells. I'm guessing when we show the same sort of charts for NVIDIA "launched but not benchmarked by AnandTech" we'll see the exact same comments, only it will probably be by different people.
If you are gullible enough to go out and try to buy something based on a non-review press release type of article, then you deserve to be screwed, yes. And people do stupid stuff like that all the time, which is why we've ended up with lowest common denominator LCDs in laptops. But don't tell me I have bad ethics because I post an article with AMD's graphs and state, right in the text:
"As always, take these graphs for what they're worth." Or, "Results are at 1920x1080/1920x1200 with a variety of quality settings, so take the following with a grain of salt."
You want to talk about unethical practices? How about putting 2GB RAM on a GPU that's so slow that it doesn't matter how much RAM it has, and then all the OEMs selling said GPU as a $80 upgrade? Or what about building laptops that basically are designed to fail after a couple years of regular use, because the materials simply aren't designed to hold up? But you can't force a company to build and use higher quality parts, especially when consumers aren't willing to pay the cost. You can't force people to research hardware if they don't want to; so they'll go into some store and the sales people get to talk them into whatever they can, often selling them hardware that's fast in the wrong areas, more expensive than they need, and not a good fit for their particular needs.
Dracusis - Thursday, April 26, 2012 - link
I know you didn't make the charts, but as a journalist you should care about information clarity and shouldn't defend them like you did in the comment above.Oh and implying your readers "deserves exactly what they get", also not the best attitude to exhibit as a journalist.
Sure it may be a press release, but you're reporting on it and re-publishing that information.
Having said all that, I thought your statements in the article were carefully measured against the poor quality materials without being insulting. Honestly I'm not really sure why anyone got upset to begin with - perhaps we need fresh bait in the troll traps.
JarredWalton - Thursday, April 26, 2012 - link
I'm not saying our readers deserve it, I'm saying people who don't do the research and don't care to pay attention to all the information in a graph deserve what they get. What I specifically said is: "Anyone that glances at a graph and thinks, 'Wow, the red bar is four times as big as the green bar!" without actually looking at what the bars mean deserves exactly what they get.'"What's crazy is that everyone is harping on this like the data is somehow obscure. The chart starts at 0.8X and goes to 1.7X or 1.4X (depending on which graph we're looking at). To act like that is hard to understand, particularly on a tech savvy web site like ours, is ludicrous. I'm pretty sure that everyone who cares to read articles like this at AnandTech knows what the chart means. If the chart instead said, "Percent improvement" and started at 0% and went up to 70%, no one would have complained, and yet that would be just as "misleading" to the graph impaired that only stare at the bars and not the labels.
Furthermore, right below the AMD vs. AMD graph is the data showing the numbers for AMD vs. NVIDIA. Wow, everything sure is hidden and misleading when you can see a relative performance chart followed by another table showing some actual numbers. Seriously, if people take things out of context and don't read the text or the table and *think* for a minute or two, how are you going to educate them on the Internet? Anyone that clueless wouldn't know why we're even talking about mobile GPUs in the first place.
raghu78 - Tuesday, April 24, 2012 - link
Can't wait for the Alienware M17X review. Till Nvidia come out with their GTX 680M based on GK106 its one way traffic. I think even with GTX 680M it might be not so easy for Nvidia to reclaim the mobile performance crown because Pitcairn has 62.5% of the shader count of Tahiti with the exact same front end / tesselator / rasterizer setup whereas I think GK106 is going to be a halving of GK104 with lesser tesselation units. Pitcairn is AMD's best perf/watt GPU in HD 7000 series and HD 7970M will be a true next gen mobility card giving performance close to a GTX 570.JarredWalton - Tuesday, April 24, 2012 - link
NVIDIA hasn't made any statements, but I'm guessing we'll see GK104 in a laptop at some point, albeit with lower clocks. If they could get tweaked GF110 into laptops, GK104 should be easy. Now they just need yields on GK104 to reach the point where it's practical.raghu78 - Tuesday, April 24, 2012 - link
Nvidia got a GF100 aka GTX 480M into laptops but that was a unmitigated disaster because clocks suffered severely. Only when they got a GF104 aka GTX 485M with power usage suitable for laptops things were better. The GTX 485M was launched in early 2011 and midway into the 40 nm cycle. I would expect the same timeframe for Nvidia (Q4 2012 or Q1 2013) to turn a GK104 into a 100w design with decent clocks and suitable yields.Having said that as a member of the tech industry press you might know better about Nvidia's roadmap plans.