Undervolting and Overclocking on Ivy Bridge
by Ian Cutress on April 23, 2012 12:15 PM EST- Posted in
- CPUs
- Intel
- Ivy Bridge
- Z77
In the past, overclocking a processor for ‘free’ performance involved taking a cheap model and pushing it past the top end model. In the land of Intel, overclocking by any significant margin has been limited to the more expensive processors – with Sandy Bridge it was common so see a 3.4GHz processor overclocked to 4.6GHz with very little ‘effort’ for those with overclocking experience.
However, Ivy Bridge is now released and behaves differently with regard to Sandy Bridge, in a couple of perhaps alarming ways that we think you should know about. We always want to be thorough here at AnandTech with our analysis, so this article is all about our results from Ivy Bridge overclocking – especially in terms of what to look out for. Ivy Bridge overclocking is a different beast to Sandy Bridge, so we want to make sure there are several clear correlations implanted in a users mind when it comes to a stable Ivy Bridge overclock. For our other readers, we also have some notes regarding some undervolting results on Ivy Bridge.
Undervolting and Overclocking on Ivy Bridge
During my testing of the Ivy Bridge and Panther Point platform, a few truths came alive regarding how the processor functions in the platform. Here we have the next generation processor, using a 22nm process and tri-gate technology, but still using the Sandy Bridge architecture. In that respect, performance is slightly improved due to the process change and minor tweaks, power consumption should be down due to the smaller process, and voltage required for the processor should be reduced due to the process and the new technology.
Regardless of what people may think, Sandy Bridge was quite an excellent overclocker if you got hold of the K-series processors. Almost every K-series processor had no trouble hitting 4.6GHz (from 3.3GHz to 3.5GHz) with a little increase in voltage, or if you pushed it a bit, most were able to handle 5.0GHz or more. Competitive overclockers were able to see 5.5GHz on air or up to 5.9GHz on sub-zero cooling if they had a processor capable of that speed. However, for a daily machine, 4.4GHz to 4.6GHz was a good overclock, or 5.0GHz on water was still happily within temperature limits.
There have been rumors around the internet that Ivy Bridge can be a vicious monster when overclocking – I have seen stories that it runs very hot when overclocked. There has been a mixture of testing methodology as well, and I would like to dispel any myths or correct any testing that may be incomplete here and now.
Below I will take you through numbers I have gathered during testing. But two things are certain:
- Ivy Bridge gets hot with voltage.
- Ivy Bridge behaves differently to Sandy Bridge.
The key to an Ivy Bridge overclock is a combination of a good processor speed increase with as little of an increase in the voltage as possible. You may think that this should be obvious, but with Sandy Bridge we were happily ramping up the volts and frequency freely until we hit that limit. This is not the case with Ivy Bridge, and I will show you why.
My results today will come in the format of several easy to read graphs (if you excuse the use of Excel). At each point I have taken the CPU temperature under load using PovRay, a real-world thrasher of CPUs, and power consumption using OCCT. The graphs come as follows:
- Stock CPU frequency, vary voltage
- 4.4GHz CPU frequency, vary voltage
- Constant 1.25 volts, vary CPU speed
- Constant 0.90 volts, vary CPU speed
With more time I could perhaps build a better landscape of results, however these have given a clear view of how Ivy Bridge likes to perform. For clarification, the setup for these results is:
Intel i7-3770K
Intel All-In-One Liquid Cooler
MSI Z77A-GD65
G.Skill 4x4GB 2400 9-11-11
OCZ 1250W Gold ZX Series (75% efficient at 50W+, 90%+ efficient at 250W+)
2x ASUS HD 7970 GPUs
I must also clarify that these results were on an open test bed. Inside a case, temperatures may be higher. The Intel All-In-One Liquid Cooler is by no means a substantial cooler, but it should perform better than a typical low-profile type air cooler.
Stock CPU Frequency, Vary Voltage
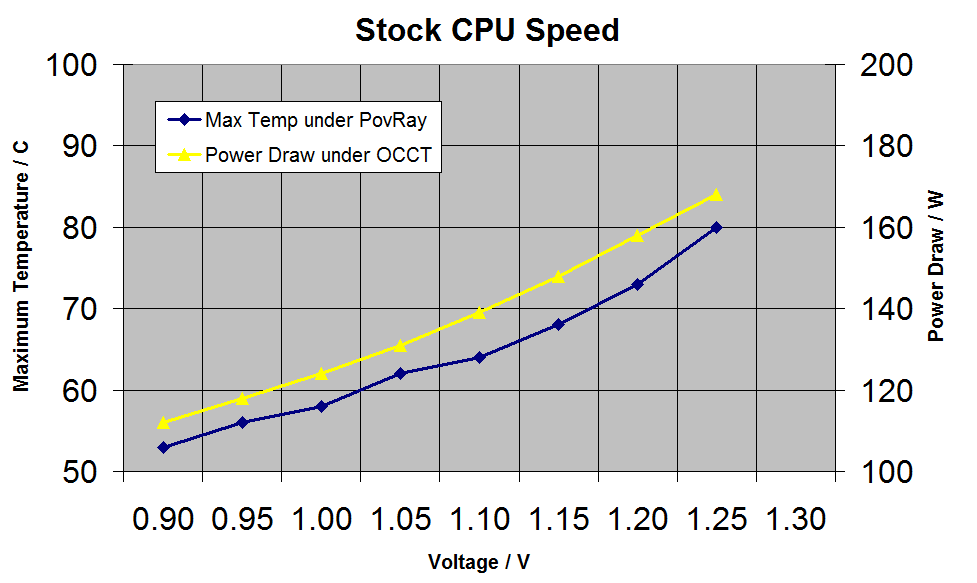
While it is not particularly surprising that an increase in voltage increases both temperature and power consumption, the rate of gain should be examined. At stock speeds, power draw increases by an average of 6W per 0.05 volts initially, moving up to 10W per 0.05 volts as we increase the voltage. With 0.35 extra volts in the processor the system moves from 112W under load to 168W – an increase of 50%. Temperature also rises quickly, from 53C at 0.90 volts to 80C at 1.25 volts.
There's also one more interesting piece of information. Our particular processor worked fine when undervolted to 0.900 volts, but at 0.850 volts it would not boot. As with all processors, your mileage may vary.
4.4GHz CPU Frequency, Vary Voltage
At a higher frequency, we can see both a leap in temperatures (especially safe temperatures) and power consumption based on voltage.
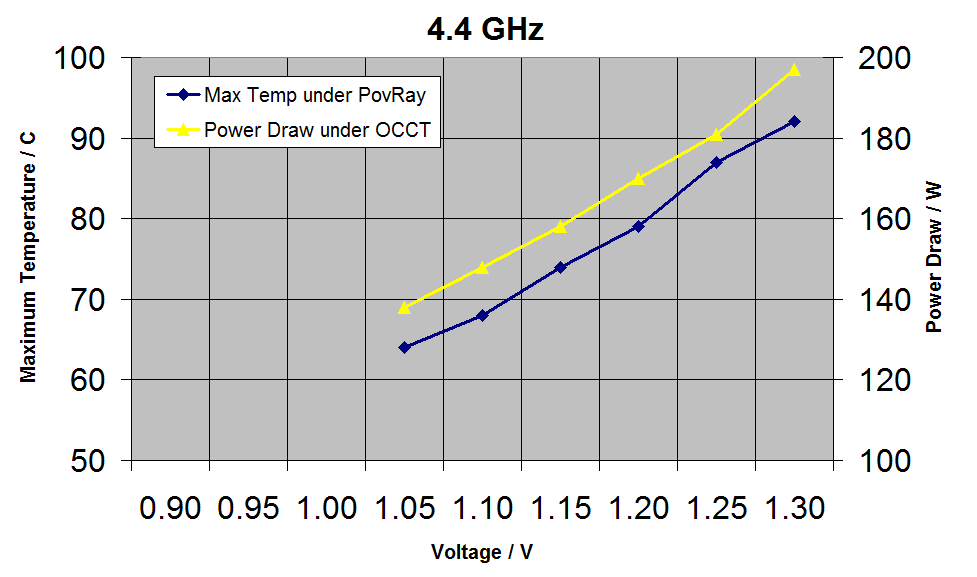
At 4.4GHz, we see that our chip is stable as low as 1.05 volts, which is around the stock voltage for this processor (or in other words, a free 500 MHz overclock). But what we see with increasing voltage is alarming. Temperatures very quickly gets north of 90C if automatic settings are not set at an appropriate level. It could be hazardous for system builders just to go straight to 1.200 volts and set a target speed without monitoring the long term effects (given dust and age, these temperatures may rise).
For the next set of results, I fix the voltage and vary the processor speed to observe the effect.
Constant 1.25 Volts, Vary CPU Speed
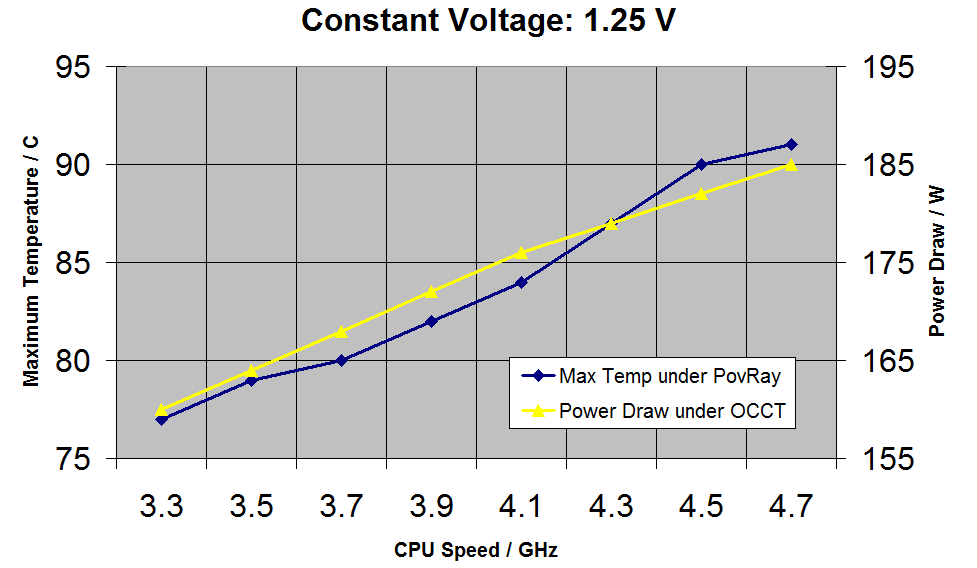
Given what we know already, it is perhaps unsurprising to see that the CPU at load runs at 77C while only at 3.3GHz in this 1.25 volts test. As we up the CPU speed, the temperature (and power draw) actually rise very slowly. At 4.5GHz, we see the temperature hit 90C, which in my book would be the absolute limit for a daily machine--I would even suggest nothing more than 80C to be safe).
This conclusively proves that if you want the best overclock for your machine, you cannot just choose a relative voltage and see how far it will go at that setting. Overclocking on Ivy Bridge needs to be methodical and done correctly so as to not introduce unnecessary heat into the system.
This brings us to the good news and bad news. The good news is that at stock settings, we have a cool and quiet processor with a nice low power draw. The bad news is that it perhaps will not overclock as well as people think it should. Those wishing for 4.8GHz at 1.4 volts (similar to Sandy Bridge) will run into a lot of issues if they think that 1.4 volts is appropriate for Ivy Bridge. In comparison, you may end up with something more reasonable like 4.6GHz at 1.1 volts, or 4.8GHz at 1.2 volts (as per some boards I have tested). Then it will be a case of deciding whether the small IPC gains that Ivy brings will be worth 200 MHz less on your CPU compared to Sandy Bridge.
My recommendation is that if you run an overclocked Sandy Bridge system right now, do not jump to Ivy Bridge. You may be severely disappointed by the overclocking performance. Ultimately, Ivy Bridge hates voltage. Moving the CPU speed up is not so bad in the case of temperatures and system power draw. What you need is the lowest voltage for the overclock you want. So when you overclock, be methodical.
Voltage and CPU Speed Correlation
Given what we found out above, I did some additional overclock testing. Starting at 0.900 volts, we achieved a maximum stable clock speed at 3.9GHz. By upping the voltage, we checked for the maximum stable overclock at each voltage, along with the temperature. Here are our results:
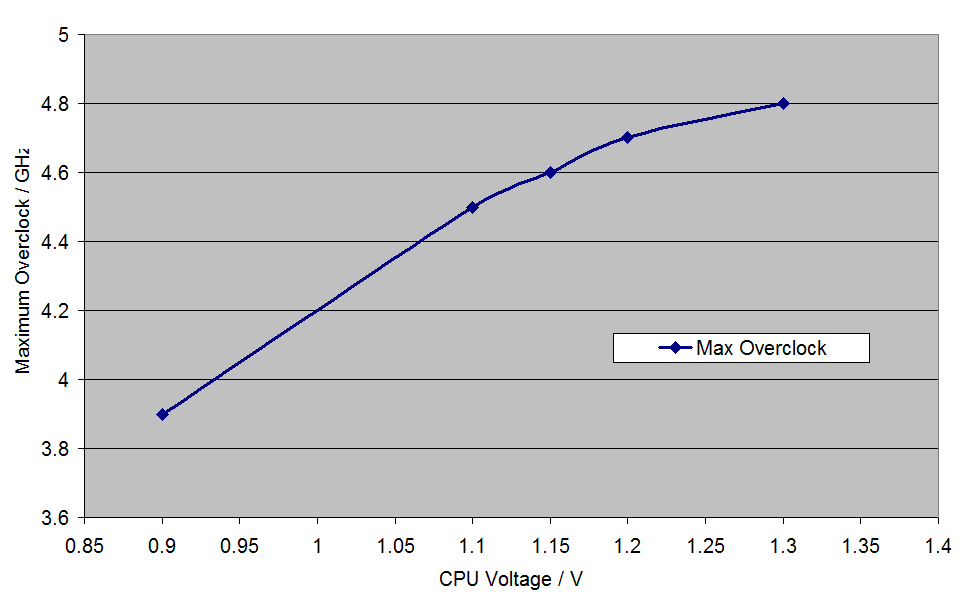
In the land of diminishing returns, more voltage is required for similar increases in CPU speed. In terms of temperature, it is easier to understand where the limits are going to be:
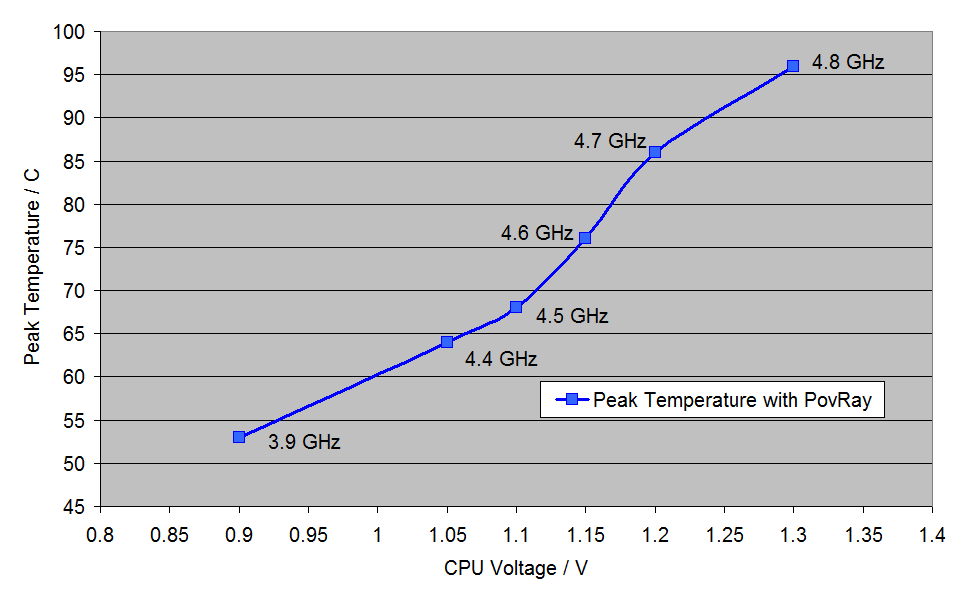
The increase of both voltage and processor frequency has a drastic effect on the peak temperature. Be wary of any overclocking results that are quoted at 1.3 volts! As always, your mileage my vary - I do not have another processor to compare with yet, so it's possible these results are poor in relation to retail samples.
A little note on underclocking….
There are others in the community who have been requesting information about the underclocking abilities of Ivy Bridge. I took some time to take readings similar to those above at a voltage below the stock voltage of my processor. Typically under load my processor has been running at 1.080 volts. The lowest voltage my processor would run at while under full load was 0.900 volts – anything lower would not boot properly. So at this voltage, I took some readings:
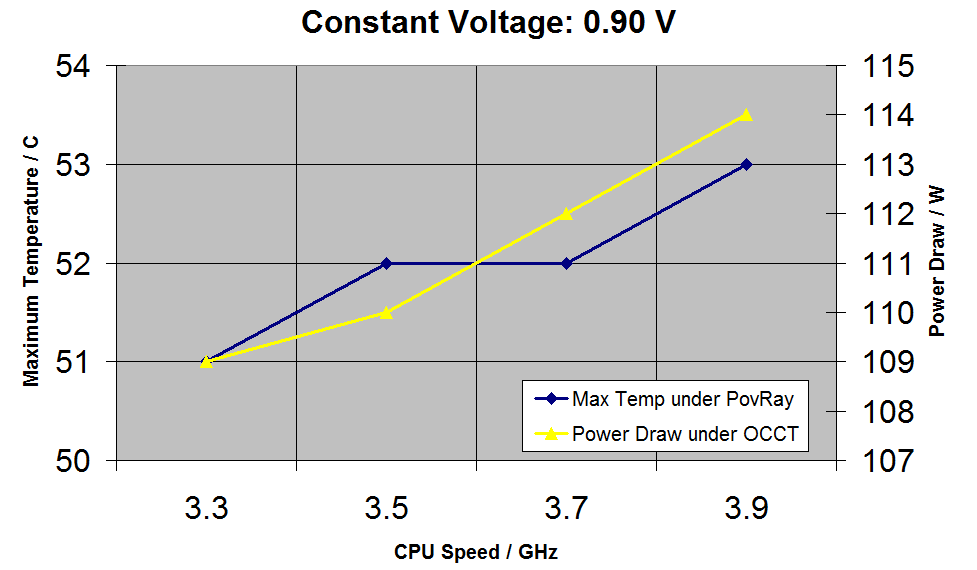
Ultimately, I was not able to overclock the processor a lot while undervolting it this much. Nevertheless, that decrease in voltage is sufficient to drive the temperature under load right down, even at an increased stock speed (3.9GHz on all cores). The potential to undervolt Ivy Bridge is there, and it will be interesting to see how Ivy Bridge overclocking and undervolting both develop over the coming months.


84 Comments
View All Comments
Shadow_k - Monday, April 23, 2012 - link
Did you disable the igp?95c you mad at 1.3V wow I wonder if Haswell face the same heat problem when overclocked
IanCutress - Monday, April 23, 2012 - link
The temperatures are what will confuse and surprise people. It really does run this hot - Sandy Bridge and Ivy Bridge, even though they are similar architectures, are made on a different process and using different transistor designs. This has seemingly had a very large effect on how the processor reacts. We may see it improve over time as the process matures, but as it stands, 95C at 1.30V is a real value - for a liquid cooler outside a case. So in a case it would perhaps be worse.Ian
bah12 - Monday, April 23, 2012 - link
Wouldn't this be expected from a pure physics perspective. Since a 22nm node has drastically shrunk the surface area in contact with the heat sink. Especially with the IGP off. The heat is now concentrated to a much smaller area, so it is all the more difficult to transfer that heat to the heat sink.MrSpadge - Monday, April 23, 2012 - link
Yes, dissipating heat from a smaller die is harder, i. e. will leave your chip hotter, given the same cooling device.vol7ron - Tuesday, April 24, 2012 - link
That's true, given the same heat; however, if you're using less current (lower voltage), the heat generated should also be less. If the current:surface area is a perfect ratio, the correlation of heat should also be close to 1. So as size decreases, so should heat.The problem, though, is that the efficiency of the transistors are questionable. Sure there may be more, but because you're creating them at a smaller scale, it could be less efficient releasing more electricity/heat to the external system.
In addition, the materials used in the tri-gate setup is unknown, which could also impact the heat retained in the system.
As Ian stated, as the manufacturing process matures, they could find ways to improve the process. This could lead to reduction in heat, and thus an increase in performance.
CeriseCogburn - Friday, May 25, 2012 - link
In a move quite uncharacteristic for me I'd just like to praise you for the very worthy and interesting article well done and setting the skewed misperceptions record straight.Very good. Much appreciated. Definitely unique and cutting edge. Worthwhile.
MrSpadge - Monday, April 23, 2012 - link
I don't thik they're equal as IB should consume considerably less power for similar clock speeds (if you stay at sane voltage levels).IanCutress - Monday, April 23, 2012 - link
To answer your original question, for these tests I was running on discrete graphics without Virtu MVP, so the iGPU should have been power gated into a low state.Ian
Kevin G - Monday, April 23, 2012 - link
Would it be possible to adjust the graphs to have similar ranges for their axis? It'd the make the two first two graphs at stock and 4.4 Ghz much easier to compare. This would also apply to the constant 1.25V graph and the underclocking graph.Also would it be able to label each point on the PovRay test with the clock speed at that particular voltage (or are these values obtained at a constant clock)?
IanCutress - Monday, April 23, 2012 - link
Apologies, I should make it more clear. The graph with a single line of Temperature against voltage should be read in conjunction with the overclock graph. So at 0.90 V, we are at 3.9 GHz, 1.1V @ 4.4 GHz, 1.15V @ 4.6, 1.20V @ 4.7, 1.30V @ 4.8. Which means that perhaps 1.15 V at 4.6 GHz is a happy medium.Ian