Micron C400 mSATA (128GB) SSD Review
by Anand Lal Shimpi on April 10, 2012 8:00 AM ESTRandom Read/Write Speed
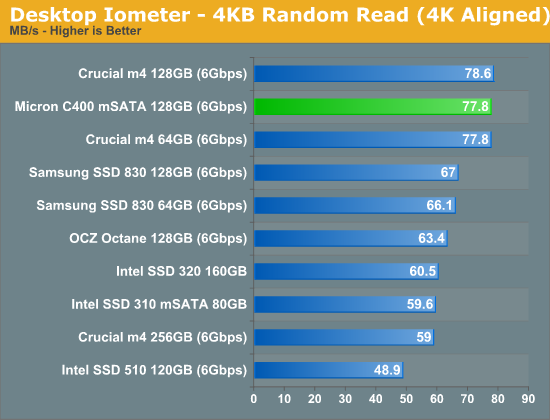
The four corners of SSD performance are as follows: random read, random write, sequential read and sequential write speed. Random accesses are generally small in size, while sequential accesses tend to be larger and thus we have the four Iometer tests we use in all of our reviews.
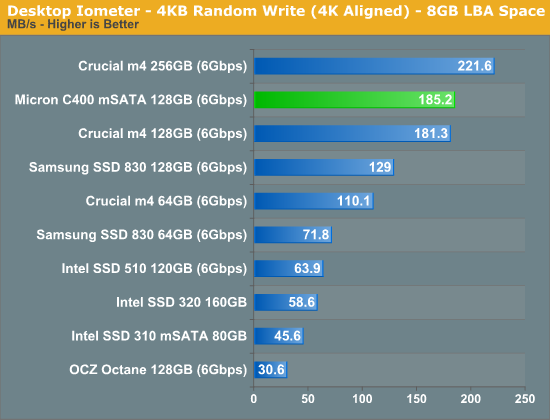
Our first test writes 4KB in a completely random pattern over an 8GB space of the drive to simulate the sort of random access that you'd see on an OS drive (even this is more stressful than a normal desktop user would see). I perform three concurrent IOs and run the test for 3 minutes. The results reported are in average MB/s over the entire time. We use both standard pseudo randomly generated data for each write as well as fully random data to show you both the maximum and minimum performance offered by SandForce based drives in these tests. The average performance of SF drives will likely be somewhere in between the two values for each drive you see in the graphs. For an understanding of why this matters, read our original SandForce article.
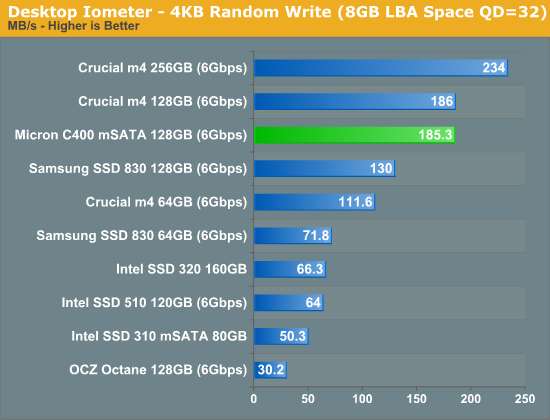
Many of you have asked for random write performance at higher queue depths. What I have below is our 4KB random write test performed at a queue depth of 32 instead of 3. While the vast majority of desktop usage models experience queue depths of 0 - 5, higher depths are possible in heavy I/O (and multi-user) workloads:
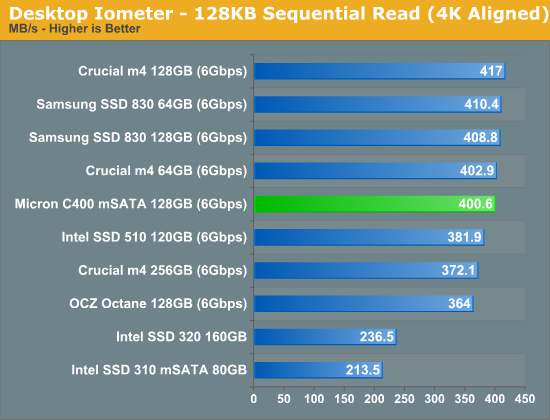
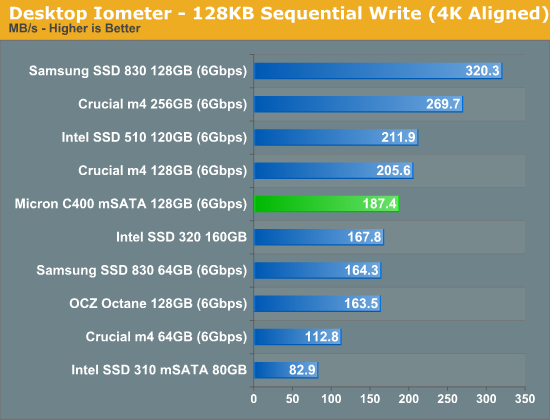
Sequential Read/Write Speed
To measure sequential performance I ran a 1 minute long 128KB sequential test over the entire span of the drive at a queue depth of 1. The results reported are in average MB/s over the entire test length.
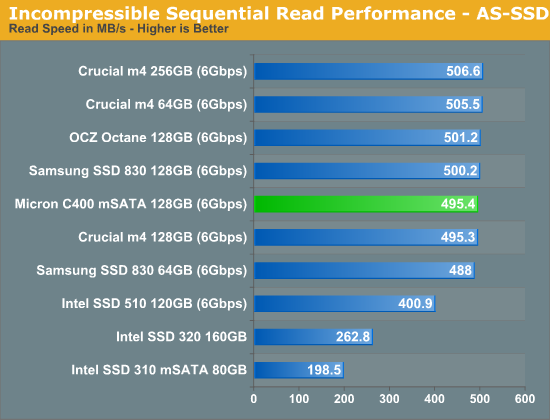
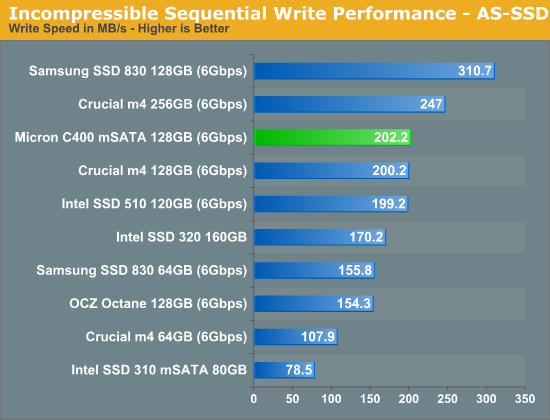
AS-SSD Incompressible Sequential Performance
The AS-SSD sequential benchmark uses incompressible data for all of its transfers. The result is a pretty big reduction in sequential write speed on SandForce based controllers.


47 Comments
View All Comments
UltraTech79 - Sunday, April 15, 2012 - link
"And in 95% of all I/O operations are random I/O."You're either an idiot, a liar or both. I'll take Anands' word and common techy sense over yours.
http://www.anandtech.com/show/4253/the-crucial-m4-...
http://www.anandtech.com/show/4253/the-crucial-m4-...
QChronoD - Tuesday, April 10, 2012 - link
I think it'd be useful if you added a "standard" hard drive to the power graphs, just so people can more easily see whether it consumes less power than an old platter drive.Also, have you put any thought to putting up a table that lists the total energy used to complete your benchmarks? I've seen that some of the faster drives draw more power, but wouldn't it sometimes work out that it still uses less energy since it completes the test faster?
Demon-Xanth - Tuesday, April 10, 2012 - link
I would honestly love to see desktop motherboards have a port for these on board, and have the form become common enough that you could just snap one on and eliminate the cables associated with it. SFF PCs could become single board affairs with cabling only for power and an optional optical drive.dragonfriend0013 - Tuesday, April 10, 2012 - link
Now imagine this attached to a modified Rasberry Pi. Ultra small computer, with storage to boot. And all powered by USB. That will be the day. And to push the envelope further, display using the Google's Project Glass. ULTIMATE!!bobsmith1492 - Tuesday, April 10, 2012 - link
Power's still a little high to go from USB; USB can deliver 4.5W, while this drive takes up to 4W while writing. That only leaves 0.5W for the rest of the mini-puter.rs2 - Tuesday, April 10, 2012 - link
So what exactly does a 36TBW mean, in useful terms?As in, if the drive is used for the primary OS install, then how long will it typically take to accumulate 36 TB of writes, and what happens when that number is reached? Compared to other drives of similar capacity, is 36TBW good, middling, or poor? Is there any empirical data showing a correlation between SSD longevity and "Endurance Spec"? If so, what is it?
Jambe - Tuesday, April 10, 2012 - link
What was the drive hooked up to for this test? I would appreciate more upfront methodology recaps in these reviews.I am also curious as to whether the mSATA ports on motherboards (for example the upcoming Gigabyte Z77 ones) are 3 Gbps or 6 Gbps ports...
AnnonymousCoward - Wednesday, April 11, 2012 - link
Wake me up when you decide to do a real world test. You know, the time it takes to do something, like boot up or load a program. That's more meaningful than any synthetic benchmark.theSeb - Wednesday, April 11, 2012 - link
You clearly have not been reading this site for very long and don't understand much about SSD performance.Anandtech used to include those exact benchmarks and they became pointless because in those types of tests the performance across SSDs is nearly the same. I suggest educating yourself before opening your mouth and looking like a luddite.
AnnonymousCoward - Wednesday, April 11, 2012 - link
What a foolish response. You're wrong because I have been reading the site for a long time, including the first SSD articles.Your own words validate my point! If *actual* performance is nearly the same, that's what we want to know!! It's stupid to only look at meaningless graphs that show alleged large differences.
The real performance difference is all that matters. And if that's very small, then we know to buy based on price and reliability!