NVIDIA GeForce GTX 680 Review: Retaking The Performance Crown
by Ryan Smith on March 22, 2012 9:00 AM ESTPower, Temperature, & Noise
As always, we’re wrapping up our look at a new video card’s stock performance with a look at power, temperature, and noise. With new process nodes being the lifeblood of the GPU industry, each new process gives GPU manufacturers a chance to move their product along a continuum; do they take advantage of a power consumption reduction for the same performance level, a performance increase for the same power consumption, or something in between? For NVIDIA the answer is a bit of “all of the above”, as while the GK104 based GTX 680 is more a direct successor of the GF114 based GTX 560 Ti in terms of how the GPU was built, NVIDIA has increased their power consumption while at the same time decreasing their die size relative to GF114.
| GeForce GTX 680 Voltages | ||||
| Ref GTX 680 Base Load | Ref GTX 680 Boost Load | Ref GTX 680 Idle | ||
| 1.062v | 1.175v | 0.987v | ||
As we noted in our look at GPU Boost, the operating voltage of the GTX 680 depends on the quality of the GPU and the clockspeed it runs at. The higher the clockspeed, the higher the operating voltage, starting from a typical voltage of 1.062v at the base clockspeed of 1006MHz, up to 1.175v at the peak clockspeed of our sample of 1110MHz. Idle voltages are far most consistent however, with the GTX 680 always dropping to 0.987v at idle.
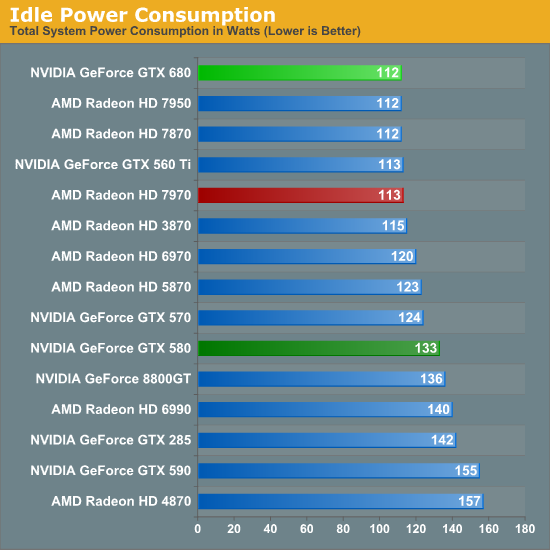
Speaking of idle, let’s start there. NVIDIA idle power consumption hasn’t significantly changed relative to GTX 560 Ti – not to say that NVIDIA hasn’t been working on this factor, but the low-hanging fruit has long been plucked. At 112W at the wall the GTX 680 is actually tied for the lowest power consumption among contemporary cards past and present, but with an estimated 15W idle TDP it’s not significantly different from any of those cards.
One interesting point though is that because GK104 is a GF114 derivative rather than a GF110 derivative, the GTX 680 does much better here compared to the GTX 580. We’re saving over 20W at the wall thanks to fewer RAM chips, less power regulation circuitry, and like most other things relating to GTX 680, a general increase in efficiency.
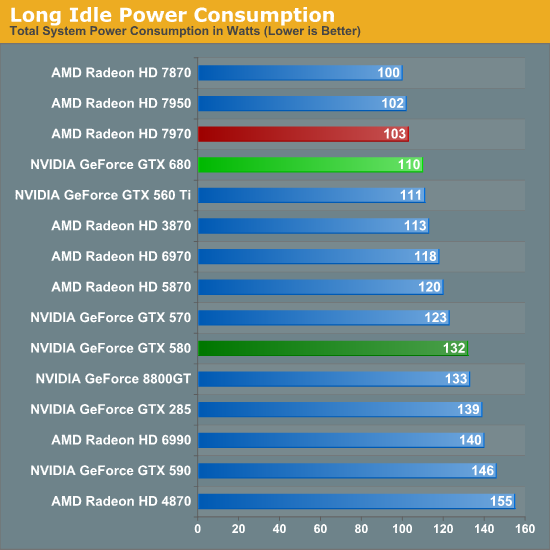
One thing NVIDIA specifically hasn’t touched though is the so-called “long idle” state where the system is powered up but the monitor is blank. GTX 680 shaves off a watt here versus GTX 560 Ti and 22W versus GTX 580, but without any special technology to further step down, they can’t match AMD and their ZeroCore Power technology.
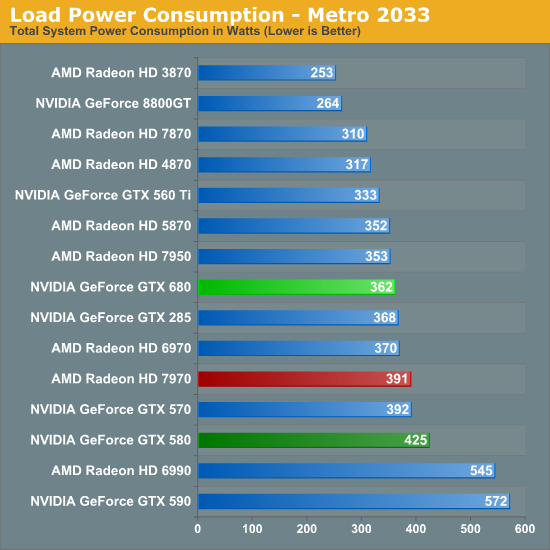
Shifting into load power consumption, our first measurement is from running our Metro 2033 benchmark. The results are roughly where we’d expect them, with the GTX 680 drawing more power than the GTX 560 Ti, but less power than the Radeon HD 7970, and compared to the GTX 580 significantly less power. Things are much closer compared to the 7950 however thanks to its similar 200W PowerTune limit, with the GTX 680 drawing only 9W more at the wall.
Because the performance of the video card here impacts the CPU load by requiring more frames to be prepared, power consumption does go up slightly with performance increases, which means some of the power consumption growth we’re seeing here relative to the GTX 560 Ti is a result of that performance gap, but measuring from the wall doesn’t let us fully separate it. NVIDIA’s power target GPU Boost on Metro 2033 is 170W, the same as the GTX 560 Ti’s TDP, but in all likelihood power consumption has jumped up at least 10W, while power consumption compared to the 7950 is probably a wash.
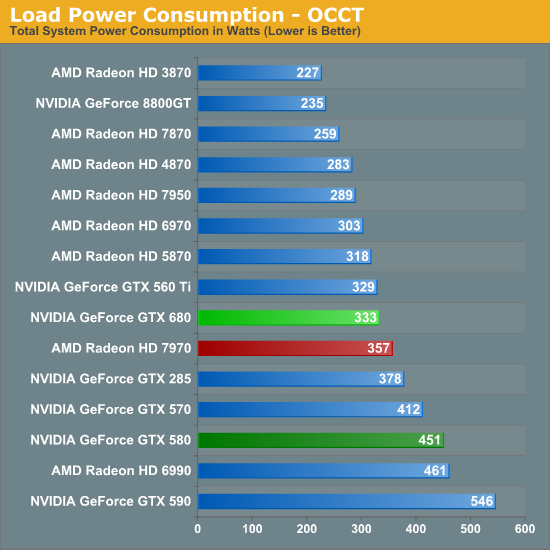
Our other power measurement is our pathological case with OCCT. In this case NVIDIA’s lack of a true throttling system continues to be to their disadvantage, as while AMD’s cards can cap their power consumption NVIDIA’s cards must keep going. In spite of this power consumption relative to the 7970 is still lower by 25W, but it blows past the 7950 by 44W. On the NVIDIA side of things though we can see just how much a smaller die and 28nm improve on matters compared to the GTX 580 – the 118W difference is nothing short of staggering. NVIDIA’s big GPUs can capture the performance crown, but they come with a high power cost, which makes taking the crown with the much smaller GK104 all the more important for NVIDIA.
On that note, it’s interesting to see that while power consumption runs high compared to AMD’s cards, compared to the GTX 560 Ti, power consumption has only ticked up by 4W. This reflects the fact that the GTX 680 is the successor to the GTX 560 Ti’s design, which means both cards have similar TDPs, though we would have actually expected the gap between the two to be wider. So in the worst case scenario NVIDA is exceeding our expectations.
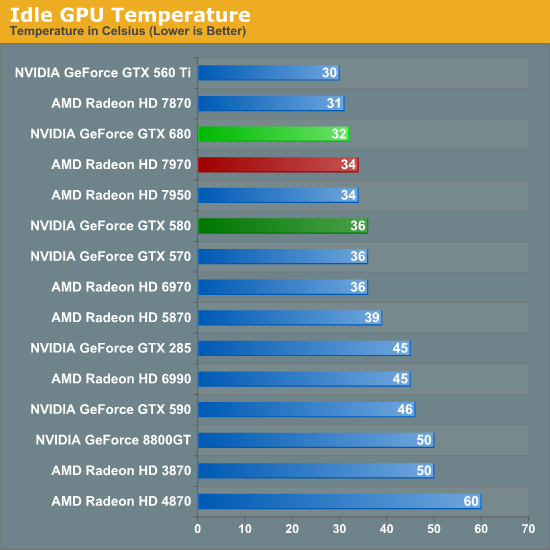
Moving past power consumption we have our look at temperatures, one of the two physical attributes that’s a derivative of power consumption. Idle temperatures aren’t too hard to do well at so long as your idle power consumption is solid and this is indeed the case for the GTX 680. The use of a blower means that NVIDIA can’t match the raw efficiency of the GTX 560 Ti, but they actually manage to edge out the Radeon HD 7900 series here. More to the point this continues what has been a long trend with regards to reducing idle temperatures; since the 8800GT the idle temperatures of NVIDIA’s top GPUs have dropped from a toasty 50C to 32C.
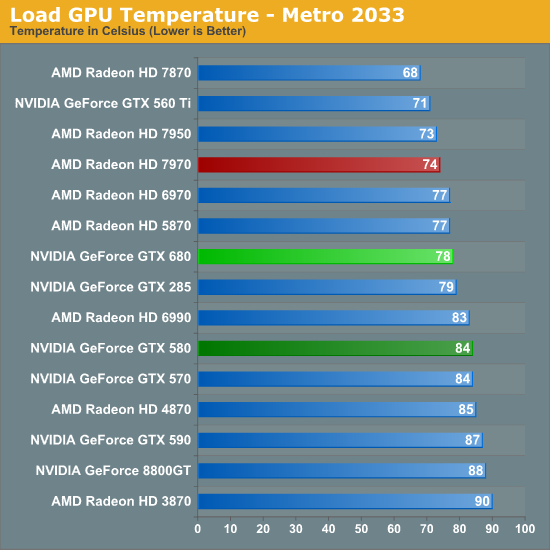
As for load temperatures, we’re once more in a familiar situation regarding NVIDIA and AMD design strategies. AMD’s aggressive cooling strategy keeps their 7900 cards in the mid-to-low 70s, while NVIDIA favors slightly higher temperatures for what we’ll see translates into less noise. At 78C under Metro NVIDIA is not repeating the common 80C+ temperatures the GTX 570 and GTX 580 reach, which is a reflection of the smaller GPU and smaller manufacturing process. NVIDIA’s max operating temperature for the GTX is 98C, so we have a good 20C to play with when it comes to overclocking.
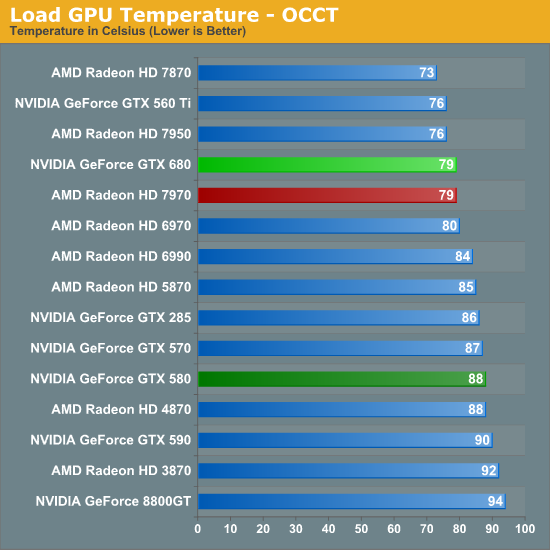
Switching over to OCCT, we suddenly find ourselves in an interesting situation when NVIDIA and AMD become relatively equalized. At 79C both the 7970 and GTX 680 are running at the same temperature, an unexpected situation given the latter’s lack of a throttling mechanism for OCCT. Once again it also drives a large gap between the GTX 680 and GTX 580, having reduced temperatures by 9C. And at the same time temperatures are up only 3C compared to the GTX 560 Ti, even with its lower power consumption and open air cooler. However if and when Big Kepler does come, I would expect GTX 580-like temperatures to return.
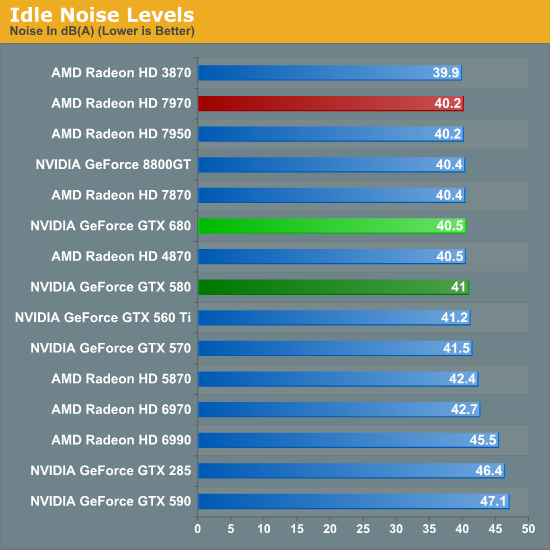
Last but not least we have our look at noise, which is typically the most important of the 3 physical attributes of a video card. Like idle temps, idle noise is largely a solved problem, which is why all of our results cluster around 40dB. The GTX 680 is 0.5dB quieter than the GTX 580 and 0.3dB louder than the 7970, but at this range the difference is nearly academic as noise from other system components is the biggest contributing factor.
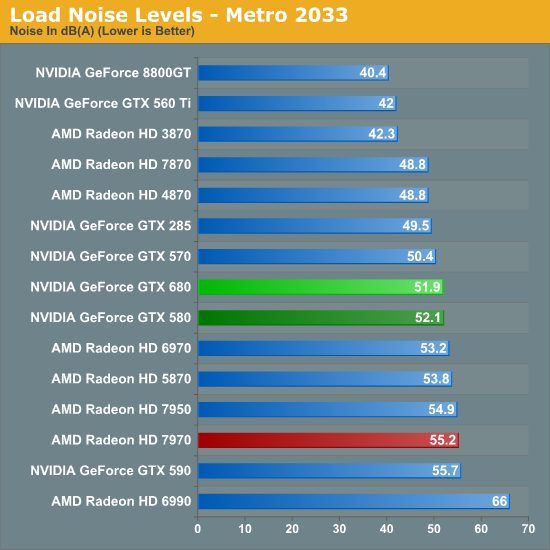
Now how does the GTX 680 fare in load noise? The answer depends on what you want to compare it to. Compared to the GTX 580, the GTX 680 is practically tied – no better and no worse – which reflects NVIDIA’s continued use of a conservative cooling strategy that favors noise over temperatures. At the same time, compared to the GTX 560 Ti this is a massive increase in noise, with just shy of a 10dB jump. The difference comes down to a few things, the most important of which is that the GTX 680 has a closed blower instead of the GTX 560 Ti’s unusually impressive open air cooler. At the same time as we’ve seen power consumption is up versus the GTX 560 Ti, so maintaining 42dB wouldn’t have been very practical even with another open air cooler.
Finally we have the Radeon comparison, where NVIDIA does quite well. AMD’s aggressive cooling strategy combined with the higher power consumption of the 7970 means that the 7970 is on the wrong side of the GTX 680 here, with the GTX 680 generating 3.3dB less noise. So while NVIDIA failed to significantly improve on the GTX 580 they did beat out AMD, which is going to be the more important difference for most buyers. All things considered I’m wondering if NVIDIA still couldn’t have done better here, but I think the limiting factor here is that NVIDIA doesn’t have a whole ventilation slot to work with.
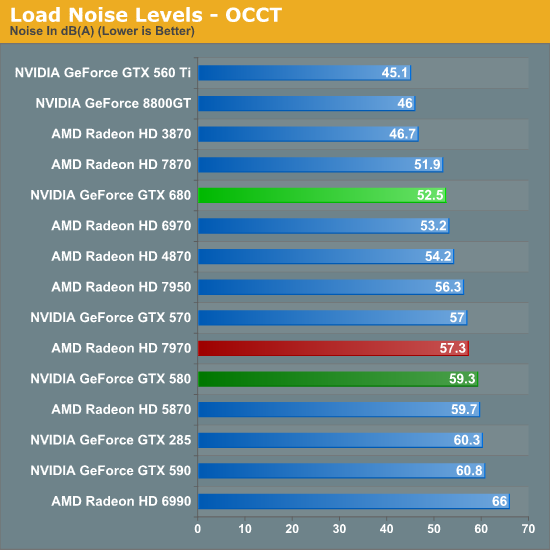
Last, but not least, we have our look at OCCT noise. Even with a lack of throttling, the smaller range between NVIDIA’s typical and max power consumption thanks to GPU Boost – and thereby a smaller range between their typical and max heat generation – has kept both their temperatures and noise in check when moving from Metro to OCCT. NVIDIA has effectively extended their lead here, with a 4.8dB gap between the GTX 680 and the 7970, and an even larger 6.8dB gap between the GTX 680 and the GTX 580. The only real loss here is against the GTX 560 Ti, which like we saw with Metro, is simply well ahead of anything else due to its open air cooler.
Of course NVIDIA has one of the lowest power consuming video cards with a closed blower, which means they are already starting these noise tests with a favorable position. The only contemporary blower to best the GTX 580 is the 7870, and even that is only by 0.6dB.
Wrapping things up here, all things considered NVIDIA does seem to have a good job reaching balance with temperature and noise here. Their lower power consumption keeps them more than competitive with the Radeon HD 7900 series and GTX 570/580 right off the bat, and combined with their balanced cooler we’re seeing temperatures that are not too hot, and noise levels that are not too loud. There’s no doubt someone is going to try to best the reference GTX 680 in the future with a dual fan open air cooler though, so it will be interesting to see if it will be possible to improve on the GTX 680 by giving up direct cooling efficiency for lower noise levels.


404 Comments
View All Comments
saturn85 - Tuesday, March 27, 2012 - link
can we have folding@home benchmark?warmbit - Tuesday, March 27, 2012 - link
I invite you to the statement of GTX680 card performance based on the results of the eight websites (tom's too):http://translate.google.pl/translate?hl=pl&sl=...
lhotdeals - Wednesday, March 28, 2012 - link
I never posted a reply to reviews... but the conclusion of this review leaves me baffled. It is clear that 680 has its advantages, but looking at the numbers, the 680 and 7970 trades punches pretty equally in terms of performance. 680 does beat the 7970 in power usage and noise level, but the actual lead is miniscue...I do not see how the reviewer can reach the dominating position of the 680 in the conclusion... It is nothing but misleading to an otherwise great review with tons of data points.
sngbrdb - Wednesday, March 28, 2012 - link
"...at the end of the day it’s NVIDIA who once again takes the performance crown for the highest performing single-GPU card."Are you kidding me?? Are we looking at the same charts? This card only "excels" on the lower end of resolution and quality settings. And in many of your charts, the cards that beat it in higher resolutions are conspicuously absent in the lower-resolution charts (the GTX 590 and Radeon 6990 are frequently missing).
GPU reviews need to be written by someone who isn't biased toward a brand, and Mr. Smith, that is clearly not you.
CeriseCogburn - Thursday, March 29, 2012 - link
Sorry, you can't lie to yourself forever - how about a massive database with percentages and totals from many reviews...http://translate.google.pl/translate?hl=pl&sl=...
At the highest resolutions amd still loses. Amd also loses the lower and lowest Enjoy.
sngbrdb - Friday, March 30, 2012 - link
My comments are about the conclusions Mr. Smith draws form the charts he displays, not about whether the card does better elsewhere. The charts that Mr. Smith shows and the conclusions he draws from them are not logical... there may be other data out there that supports his conclusions, but that would mean the data he's displaying here is flawed/inaccurate. Either way, you can't look at those charts and act like the 680 has slaughtered AMD, you end up sounding like a fanboy.And charts need to be consistent about the cards being compared... you can't put a card in the chart for one resolution, and leave it out in another.
CeriseCogburn - Friday, March 30, 2012 - link
Yes, and anandtech's charts percentages are at the link I provided, that prove you incorrect, period.Reality doesn't make anyone a fanboy.Ignoring reality does.
_vor_ - Saturday, March 31, 2012 - link
So does replying to nearly all 40 pages of discussion flagrantly waving the NVIDIA banner. Maybe you need to look up the word hypocrisy.CeriseCogburn - Friday, April 6, 2012 - link
Vor you're angry because you got caught waving the amd flag * incorrectly*.There wouldn't be a need if there wasn't false information being spread about.
It's no wonder it happens when the amd card loses.
Addressing it is helpful and the right thing to do.
sngbrdb - Monday, April 9, 2012 - link
Um.... the charts at the link you provided point back to this article. Please do your research before being rude.From the article:
---------------------------------
Sources of data:
...
Anandtech - www.anandtech.com/show/5699/nvidia-geforce-gtx-680-review