NVIDIA GeForce GTX 680 Review: Retaking The Performance Crown
by Ryan Smith on March 22, 2012 9:00 AM ESTTheoreticals
As with any new architecture, we want to take a few moments to look at theoretical performance. These numbers shouldn’t be taken too seriously for cross-vendor comparison, but these numbers often tell us more about interesting architectural improvements that occur from one generation to the next.

Our first theoretical test is perhaps the most perplexing: 3DMark Vantage’s pixel fill test. Typically this test is memory bandwidth bound as the nature of the test has the ROPs pushing as many pixels as possible with as little overhead as possible, which in turn shifts the bottleneck to a mix of ROP performance and the memory bandwidth needed to feed those ROPs.
Compared to the GTX 580, the GTX 680 has almost exactly the same amount of memory bandwidth (192GB/sec) and only 86% of the theoretical ROP performance (37Gpix vs. 32Gpix). In short, it shouldn’t outperform the GTX 580 here, and yet it outperforms the 580 by 33%.
Why does it do this? That’s the hard thing to answer. As we mentioned in our look at GK104’s architecture, NVIDIA did make some minor incremental improvements to their ROPs coming from GF114, such as slightly improved compression and improved polygon merging. One of those may very well be the contributing factor, particularly the compression improvements since this is a typically memory bandwidth bottlenecked test. Alternatively, it’s interesting to note that the difference between the two video cards is almost identical to the difference in the core clock. GTX 560 Ti’s results tend to blow a hole in this theory, but it bears consideration.
In any case, it’s an interesting turn of events and hopefully one that isn’t simply an edge case. As we’ve seen in our benchmarks GTX 680 has strong performance – even if its lead compared to the 7970 diminishes with resolution – but compared to the GTX 580 in particular it needs strong ROP performance across all games in order to deliver good performance at high resolutions and anti-aliasing.
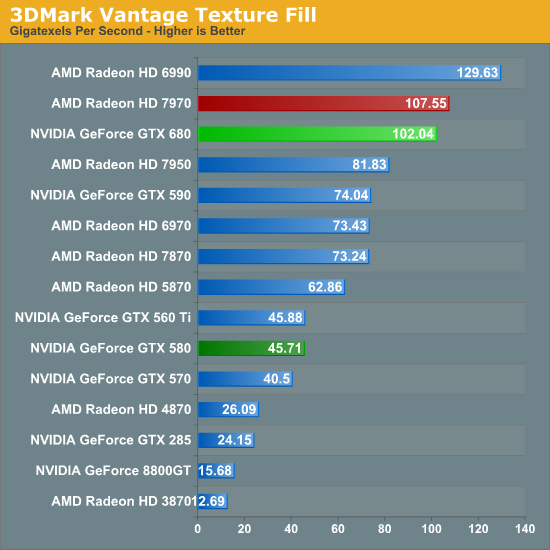
Our second theoretical test is 3DMark Vantage’s texture fill test, which to no surprise has the GTX 680 handily clobbering all prior NVIDIA cards. NVIDIA’s inclusion of 128 texture units on GK104 versus 64 on their previous generation GPUs gives the GTX 680 far better texturing performance. The 30%+ core clock difference only serves to further widen the gap.
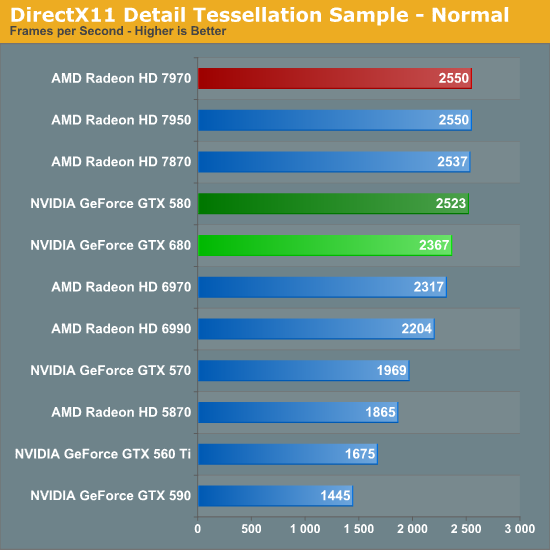
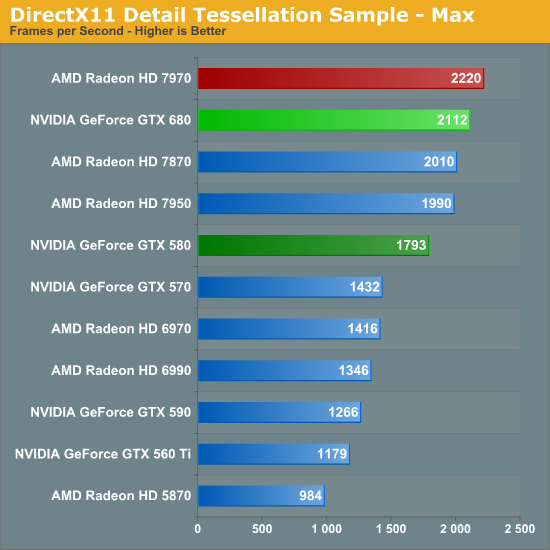
Our third theoretical test is the set of settings we use with Microsoft’s Detail Tessellation sample program out of the DX11 SDK. Overall while NVIDIA didn’t make any significant changes to their tessellation hardware (peak triangle rate is still 4/cycle), they have been working on further improving performance at absurdly high tessellation factors. You can see some of this in action at the max factor setting, but even then we’re running into a general performance wall since the Detail Tessellation program can’t go to the absolute highest tessellation factors NVIDIA’s hardware supports.
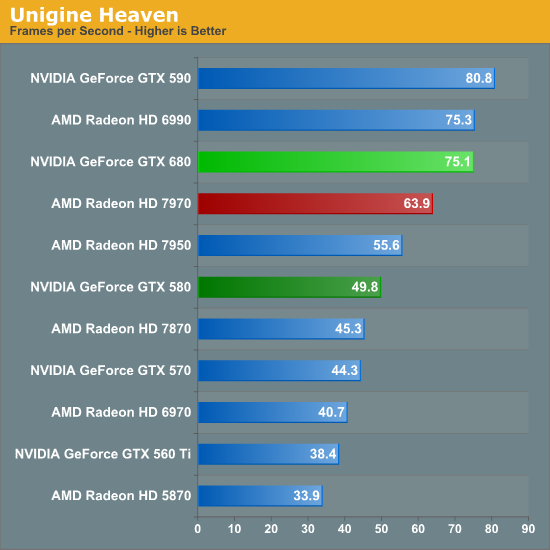
Our final theoretical test is Unigine Heaven 2.5, a benchmark that straddles the line between a synthetic benchmark and a real-world benchmark as the engine is licensed but no notable DX11 games have been produced using it yet. In any case the Heaven benchmark is notable for its heavy use of tessellation, which means it’s largely a proxy test for tessellation performance. Here we can see the GTX 680 shoot well ahead of the GTX 580 – by more than we saw in the DX11 Detail Tessellation sample – but at the same time there’s a lot more going on in Heaven than just tessellation.
Honestly at this point in time I’m not sure just how much more tessellation performance is going to matter. Until DX11 is the baseline API for games, tessellation is still an add-on feature, which means it’s being used to add fine detail to specific models rather than being used on everything in a game world. This demands good tessellation at high factors but at the same time it’s subject to diminishing returns on the improvement to image quality as triangles reach single pixel sizes and smaller. To that end I’m still waiting to see the day where we see tessellation scale similarly to textures – that is by using full MIP chaining of displacement maps – at which point we can evaluate tessellation performance similar to texture performance when it comes to both measuring the performance hit and evaluating the difference in image quality.


404 Comments
View All Comments
toastyghost - Sunday, April 29, 2012 - link
oh look, a fanboy fight in the comments on a hardware site. how very original.jewie27 - Sunday, July 8, 2012 - link
tonnes? WTF?santiagodraco - Thursday, March 22, 2012 - link
If you think overclocking RAM (which you imply but which isn't necessarily even true) makes that big of a difference than overclocking the GPU then you are fooling yourself.The GPU does the work, not the ram.
As for price/performance yes the 680 appears to be better now (they are ALWAYS leapfrogging each other) but wait until ATI releases their new variation, cuts prices to match and beats Nvidia by 20% or more... it will happen. Does every time :)
vol7ron - Thursday, March 22, 2012 - link
They're both important.What does a fast number cruncher mean, if it's busy waiting on the numbers?
Both CPU and RAM are important and they can both be bottlenecks.
Iketh - Thursday, March 22, 2012 - link
"The GPU does the work, not the ram."LOL you can't say something more stupid!
grave00 - Friday, March 23, 2012 - link
Sometimes I really wish the editors could come in here and mark posts with strong agreement or disagreement with statements. I'd like to know what they think of things like. GPU does all the work vs RAM doesn't do much. I have an uninformed opinion. The interested but uninformed need some kind of truth detector. Maybe just for a few pages worth. I start to lose my grip on what is real in the forum after awhile. fun though it may be.blanarahul - Tuesday, March 27, 2012 - link
Question -1To understand the statement that "GPUs do all the work and memory doesn't", consider this:-
1. You overclocked your Graphics Card, but only the core and not the memory.
You ran a benchmark and let's assume you got a score of 100.
2. Now, you overclocked your memory and ran the same benchmark again.
You got the score of 101.
This is what actually happens in MOST cases. It doesn't happen always.
Question - 2
Why it doesn't happen always?
Answer:- If you use extreme methods and take your core clock too high the memory will become a bottleneck.
Cosider that you try to overclock using Liquid Nitrogen.
1. After overclocking only the core clock to the maximum.
Benchmark score:- 150
2. You overclock your memory too.
Benchmark score:- 200
In this case the memory was holding back the GPU Core from operating at it's full potential.
But this does not happen if don't use extreme methods.
I hope this helps.
CeriseCogburn - Friday, April 6, 2012 - link
Actually the 79xx series is the 1st time in a very long time amd has had a lead, let alone a lead of 20%, let alone "leap frogging".Amd has been behind since the GTX8800 and I don't know how long before that.
Let's face it, the 79xx for 2.5 months was the 1st time amd played Frogger in a long time and made it across the street without getting flattened before stepping off the curb.
You're welcome for the correct and truth filled history.
SlyNine - Thursday, March 22, 2012 - link
Sorry but the 7970 is still much faster in crysis min fps, which I would argue is more important then average. It's faster in Metro as well.All things considered, the 7970 stands up against the 680GTX well.
Lets also consider X.264 acceleration, as far as I can tell the 680GTX has none.
CeriseCogburn - Thursday, March 22, 2012 - link
It loses in everything to 680 including 3 monitor performance.That's not standing up well, it's larger, hotter, and slower at everything, with far less features and it's $60 bucks more.
FXAA
dynamic Vsync
turbo
More features I'm sure you fans of the loser underdog don't care about as of 9 am this morning.
It's EPIC FAIL and it's not standing, it's decked to the ground and can't get up.