A Look at Enterprise Performance of Intel SSDs
by Anand Lal Shimpi on February 8, 2012 6:36 PM EST- Posted in
- Storage
- IT Computing
- SSDs
- Intel
Enterprise Storage Bench - Oracle Swingbench
We begin with a popular benchmark from our server reviews: the Oracle Swingbench. This is a pretty typical OLTP workload that focuses on servers with a light to medium workload of 100 - 150 concurrent users. The database size is fairly small at 10GB, however the workload is absolutely brutal.
Swingbench consists of over 1.28 million read IOs and 3.55 million writes. The read/write GB ratio is nearly 1:1 (bigger reads than writes). Parallelism in this workload comes through aggregating IOs as 88% of the operations in this benchmark are 8KB or smaller. This test is actually something we use in our CPU reviews so its queue depth averages only 1.33. We will be following up with a version that features a much higher queue depth in the future.
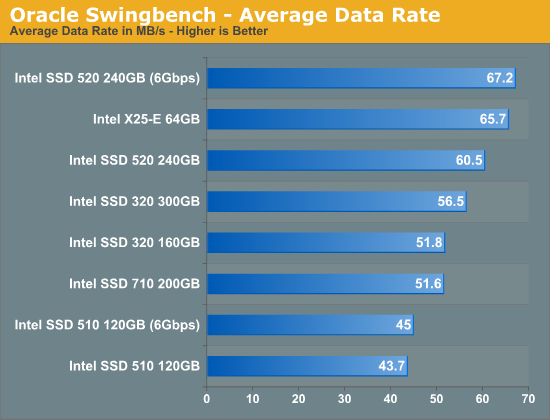
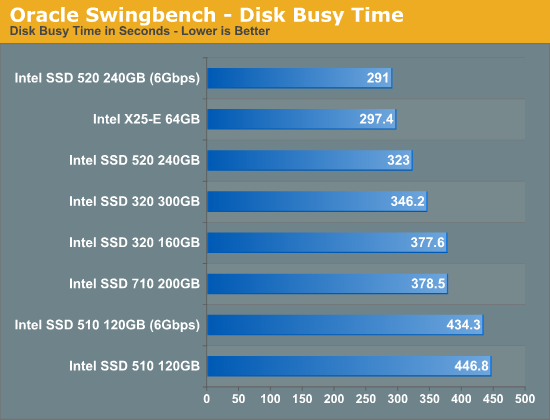
SLC NAND offers great write latency and we see a definite advantage to the older drive here in our Swingbench test. Only a 6Gbps SSD 520 is able to deliver better performance, everything else trails the 3+ year old drive. Note that the Marvell based Intel SSD 510, even on a 6Gbps controller, is the slowest drive in Intel's lineup. From a write amplification perspective, Marvell's controller has always been significantly behind Intel's own creations so the drop in performance isn't surprising. The 710 actually delivers performance that's lower than the 320, but you do get much better endurance out of the 710.
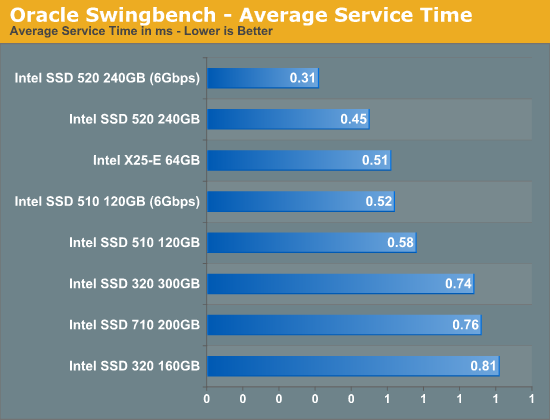
While throughput isn't much better on the 6Gbps Intel SSD 520, average service time is tangibly lower. There's clearly a benefit to higher bandwidth IO interfaces in the enterprise space, which is a big reason we're seeing a tremendous push for PCIe based SSDs. The 710 does well here but not nearly as well as the X25-E which continues to behave like a modern SSD thanks to its SLC NAND.


55 Comments
View All Comments
ssj4Gogeta - Thursday, February 9, 2012 - link
I think what you're forgetting here is that the 90% or 100% figures are _including_ the extra work that an SSD has to do for writing on already used blocks. That doesn't mean the data is incompressible; it means it's quite compressible.For example, if the SF drive compresses the data to 0.3x its original size, then including all the extra work that has to be done, the final value comes out to be 0.9x. The other drives would directly write the data and have an amplification of 3x.
jwilliams4200 - Thursday, February 9, 2012 - link
No, not at all. The other SSDs have a WA of about 1.1 when writing the same data.Anand Lal Shimpi - Thursday, February 9, 2012 - link
Haha yes I do :) These SSDs were all deployed in actual systems, replacing other SSDs or hard drives. At the end of the study we looked at write amplification. The shortest use case was around 2 months I believe and the longest was 8 months of use.This wasn't simulated, these were actual primary use systems that we monitored over months.
Take care,
Anand
Ryan Smith - Thursday, February 9, 2012 - link
Indeed. I was the "winner" with the highest write amplification due to the fact that I had large compressed archives regularly residing on my Vertex 2, and even then as Anand notes the write amplification was below 1.0.jwilliams4200 - Thursday, February 9, 2012 - link
And still you dodge my question.If the Sandforce controller can achieve decent compression, why did it not do better than the Intel 320 in the endurance test in this article?
I think the answer is that your "8 month study" is invalid.
Anand Lal Shimpi - Thursday, February 9, 2012 - link
SandForce can achieve decent compression, but not across all workloads. Our study was limited to client workloads as these were all primary use desktops/notebooks. The benchmarks here were derived from enterprise workloads and some tasks on our own servers.It's all workload dependent, but to say that SandForce is incapable of low write amplification in any environment is incorrect.
Take care,
Anand
jwilliams4200 - Friday, February 10, 2012 - link
If we look at the three "workloads" discussed in this thread:(1) anandtech "enterprise workload"
(2) xtremesystems.org client-workload obtained by using data actually found on user drives and writing it (mostly sequential) to a Sandforce 2281 SSD
(3) anandtech "8 month" client study
we find that two out of three show that Sandforce cannot achieve decent compression on realistic data.
I think you should repeat your "client workload" tests and be more careful with tracking exactly what is being written. I suspect there was a flaw in your study. Either benchmarks were run that you were not aware of, or else it could be something like frequent hibernation where a lot of empty RAM is being dumped to SSD. I can believe Sandforce can achieve a decent compression ratio on unused RAM! :)
RGrizzzz - Wednesday, February 8, 2012 - link
What the heck is your site doing where you're writing that much data? Does that include the Anandtech forums, or just Anandtech.com?extide - Wednesday, February 8, 2012 - link
Probably logs requests and browser info and whatnot.Stuka87 - Wednesday, February 8, 2012 - link
That most likely includes the CMS and a large amount of the content, the Ad system, our users accounts for commenting here, all the Bench data, etc.The forums would use their own vBulletin database. But most likely run on the same servers.