Bulldozer for Servers: Testing AMD's "Interlagos" Opteron 6200 Series
by Johan De Gelas on November 15, 2011 5:09 PM ESTVirtualization Performance: Linux VMs on ESXi
We introduced our new vApus FOS (For Open Source) server workloads in our review of the Facebook "Open Compute" servers. In a nutshell, it a mix of four VMs with open source workloads: two PhpBB websites (Apache2, MySQL), one OLAP MySQL "Community server 5.1.37" database, and one VM with VMware's open source groupware Zimbra 7.1.0. Zimbra is quite a complex application as it contains the following components:
- Jetty, the web application server
- Postfix, an open source mail transfer agent
- OpenLDAP software, user authentication
- MySQL is the database
- Lucene full-featured text and search engine
- ClamAV, an anti-virus scanner
- SpamAssassin, a mail filter
- James/Sieve filtering (mail)
All VMs are based on a minimal CentOS 5.6 setup with VMware Tools installed. All our current virtualization testing is on top of the hypervisor which we know best: ESXi (5.0). CentOS 5.6 is not ideal for the Interlagos Opteron, but we designed the benchmark a few months ago. It took us weeks to get this benchmark working and repeatable (especially the latter is hard). For example it was not easy to get Zimbra fully configured and properly benchmarked due to the complex usage patterns and high I/O usage. Besides, the reality is that VMs often contain older operating systems. We hope to show some benchmarks based on Linux kernel version 3.0 or later in our next article.
We tested with five tiles (one tile = four VMs). Each tile needs seven vCPUs, so the test requires 35 vCPUs.
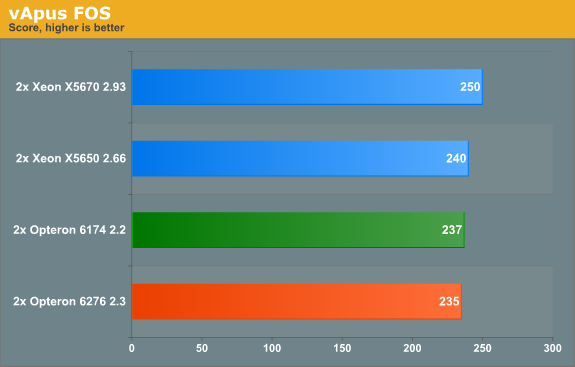
The Opteron 6276 stays close to the more expensive Xeons. That makes the Opteron server the one with the best performance per dollar. Still, we feel a bit underwhelmed as the Opteron 6276 fails to outperform the previous Opteron by a tangible margin.
The benchmark above measures throughput. Response times are even more important. Let us take a look at the table below, which gives you the average response time per VM:
| vApus FOS Average Response Times (ms), lower is better! | ||||||||
| CPU | PhpBB1 | PHPBB2 | MySQL OLAP | Zimbra | ||||
| AMD Opteron 6276 | 737 | 587 | 170 | 567 | ||||
| AMD Opteron 6174 | 707 | 574 | 118 | 630 | ||||
| Intel Xeon X5670 | 645 | 550 | 63 | 593 | ||||
| Intel Xeon X5650 | 678 | 566 | 102 | 655 | ||||
The Xeon X5670 wins a landslide victory in MySQL. MySQL has always scaled better with clock speed than with cores, so we expect that clock speed played a major role here. The same is true for our first VM: this VM gets only one CPU and as result runs quicker on the Xeon. In the other applications, the Opteron's higher (integer) core count starts to show. However, AMD cannot really be satisfied with the fact that the old Opteron 6174 delivers much better MySQL performance. We suspect that the high latency L2 cache and higher branch misprediction penalty (20 vs 12) is to blame. MySQL performance is characterized by a relatively high amount of branches and a lot of accesses to the L2. The Bulldozer server does manage to get the best response time on our Zimbra VM, however, so it's not a complete loss.
Performance per watt remains the most important metric for a large part of the server market. So let us check out the power consumption that we measured while we ran vApus FOS.
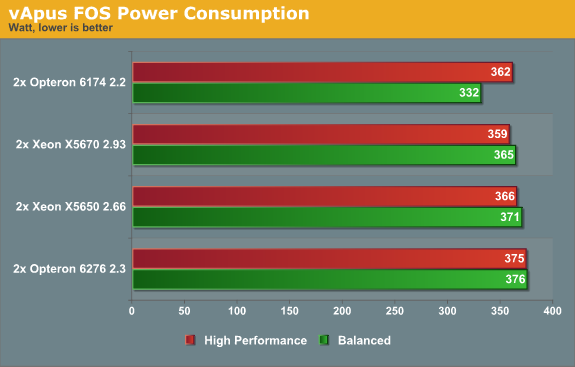
The power consumption numbers are surprising to say the least. The Opteron 6174 needs quite a bit less energy than the two other contenders. That is bad news for the newest Opteron. We found out later that some tinkering could improve the situation, as we will see further.


106 Comments
View All Comments
duploxxx - Thursday, November 17, 2011 - link
Very interesting review as usual Johan, thx. It is good to see that there are still people who want to thoroughly make reviews.While the message is clear on the MS OS of both power and performance i think it isn't on the VMware. First of all it is quite confusing to what settings exactly have been used in BIOS and to me it doesn't reflect the real final conclusion. If it ain't right then don't post it to my opinion and keep it for further review....
I have a beta version of interlagos now for about a month and the performance testing depending on bios settings have been very challenging.
When i see your results i have following thoughts.
performance: I don't think that the current vAPU2 was able to stress the 2x16core enough, what was the avarage cpu usage in ESXTOP during these runs? On top of that looking at the result score and both response times it is clear that the current BIOS settings aren't optimal in the balanced mode. As you already mentioned the system is behaving strange.
VMware themselves have posted a document for v5 regarding the power best practices which clearly mentions that these needs to be adapted. http://www.vmware.com/files/pdf/hpm-perf-vsphere5....
To be more precise, balanced has never been the right setting on VMware, the preferred mode has always been high performance and this is how we run for example a +400 vmware server farm. We rather use DPM to reduce power then to reduce clock speed since this will affected total performance and response times much more, mainly on the virtualization platform and OEM bios creations (lets say lack of in depth finetuning and options).
Would like to see new performance results and power when running in high performance mode and according the new vSphere settings....
JohanAnandtech - Thursday, November 17, 2011 - link
"l it is quite confusing to what settings exactly have been used in BIOS and to me it doesn't reflect the real final conclusion"http://www.anandtech.com/show/5058/amds-opteron-in...
You can see them here with your own eyes.
+ We configured the C-state mode to C6 as this is required to get the highest Turbo Core frequencies
"performance: I don't think that the current vAPU2 was able to stress the 2x16core enough, what was the avarage cpu usage in ESXTOP during these runs?"
93-99%.
"On top of that looking at the result score and both response times it is clear that the current BIOS settings aren't optimal in the balanced mode."
Balanced and high performance gave more or less the same performance. It seems that the ESX power manager is much better at managing p-states than the Windows one.
We are currently testing Balanced + c-states. Stay tuned.
duploxxx - Thursday, November 17, 2011 - link
thx for answers, i read the whole thread, just wasn't sure that you took the same settings for both windows and virtual.according to Vmware you shouldn't take balanced but rather OS controlled, i know my BIOS has that option, not sure for the supermicro one.
quite a strange result with the ESXTOP above 90% with same performance results, there just seems to be a further core scaling issue on the vAPU2 with the performance results or its just not using turbo..... we know that the module doesn't have the same performance but the 10-15% turbo is more then enough to level that difference which would still leave you with 8 more cores
When you put the power mode on high performance it should turbo all cores for the full length at 2.6ghz for the 6276, while you mention it results in same performance are you sure that the turbo was kicking in? ESXTOP CPU higher then 100%? it should provide more performance....
Calin - Friday, November 18, 2011 - link
You're encrypting AES-256, and Anand seem to encryrpt AES-128 in the article you liked to in the Other Tests: TrueCrypt and 7-zip pagetaltamir - Friday, November 18, 2011 - link
Conclusion: "Intel gives much better performance/watt and performance in general; BD gives better performance/dollar"Problem: Watts cost dollars, lots of them in the server space because you need to some some pretty extreme cooling. Also absolute performance per physical space matters a lot because that ALSO costs tons of money.
UberApfel - Sunday, November 20, 2011 - link
A watt-year is about $2.The difference in cost between a X5670 & 6276; $654
On Page 7...
X5670: 74.5 perf / 338 W
6276: 71.2 perf / 363 W
adjusted watt-per-performance for 6276: 363 * (74.5 / 71.2) = 380
difference in power consumption: 42W
If a server manages an average of 50% load over all time; the Xeon's supposed superior power-efficiency would pay for itself after only 31 years.
Of course you're not taking into consideration that this test is pretty much irrelevant to the server market. Additionally, as the author failed to clarify when asked, Anandtech likely didn't use newer compilers which show up to a 100% performance increase in some applications ~ looky; http://www.phoronix.com/scan.php?page=article&...
Thermalzeal - Monday, November 21, 2011 - link
Good job AMD, you had one thing to do, test your product and make sure it beat competitors at the same price, or gave comparable performance for a lower price.Seriously, wtf are you people doing?
UberApfel - Tuesday, November 22, 2011 - link
Idiots like this is exactly why I say the review is biased. How can anyone with the ability to type be able to scan over this review and come to such a conclusion. At least with the confidence to comment.zappb - Tuesday, November 29, 2011 - link
completely agree - some very strange comments along these lines over the last 11 pageszappb - Tuesday, November 29, 2011 - link
posted by ars technica - incredibly tainted in intels favourThe title is enough:
"AMD's Bulldozer server benchmarks are here, and they're a catastrophe"