Adding Vellamo to our Mobile Benchmark Suite - Six Android Phones Tested
by Brian Klug on November 16, 2011 10:43 AM EST- For a while now we've been keeping track of mobile browser performance using two relatively popular JavaScript heavy benchmarks that are a regular fixation in our smartphone reviews. If you've read any of those reviews, you should immediately be able to name them - SunSpider and RightWare's BrowserMark. Tracking JavaScript performance thus far has helped us codify and track SoC performance, but really understanding and quantifying overall browsing smoothness has remained a somewhat more daunting task. Moreover, JavaScript performance is just one facet of many that contribute to the user's perception of browsing speed.
Real web browsing performance is a unique combination of system performance, the Android browser itself, and what contributions or customizations (if any) the OEM has made in the shipping browser build. This is to say nothing of the numerous third party browsers out there. Qualcomm's Innovation Center recently made public a tool for gauging overall browser performance that it has used for a while to checkpoint and gauge performance in house and in collaboration with OEMs. We've used a subtest or two from it in a few reviews already, and it's named Vellamo.
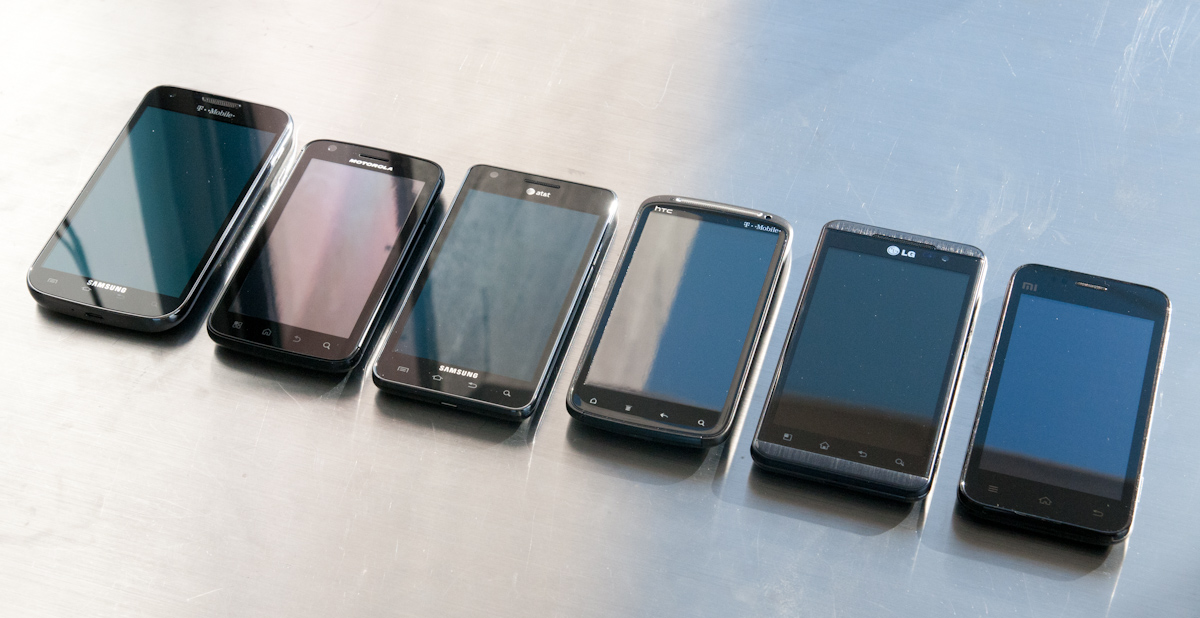
Left to right: T-Mobile SGS2, Motorola Atrix, AT&T SGS2, HTC Sensation, LG Optimus 3D, Xiaomi Mi-One
First off, Qualcomm sent us five dual-core smartphones, almost all of which we've seen and tested before. Just to be sure, we verified that nothing has been tampered with and that all were running the latest shipping OEM ROM and started fresh with a complete reset. We also added another, the T-Mobile SGS2 bringing that total to six devices.
| Smartphones | ||||||||||
| T-Mobile SGS2 | Motorola Atrix | AT&T SGS2 | HTC Sensation | LG Optimus 3D | Xiaomi Mi-One | |||||
| SoC | 1.5 GHz APQ8060 | 1.0 GHz Tegra 2 | 1.2 GHz Exynos 4210 | 1.2 GHz MSM8260 | 1.0 GHz OMAP4430 | 1.5 GHz MSM8260 | ||||
| RAM | 1 GB LPDDR2 | 1 GB LPDDR2 | 1 GB LPDDR2 | 768 MB LPDDR2 | 512 MB LPDDR2 | 1 GB LPDDR2 | ||||
| OS | Android 2.3 | Android 2.3 | Android 2.3 | Android 2.3 | Android 2.2 | Android 2.3 | ||||
The selection we've made isn't meant to be totally comprehensive, but gives an idea for just how much performance varies from one OEM to another, largely as a function of changes made to the browser on their respective versions of Android. These devices are all dual core and what I'd personally consider of the latest generation (dual core, Android 2.3, e.t.c.). We're going to be updating our Smartphone Bench category soon (something I've been behind on, as of late) with Vellamo scores for devices as well.
If you've been reading our reviews, basically every device except for the T-Mobile SGS2 (which we're going to review shortly) and the Xiaomi Mi-One should be relatively familiar. The Mi-One is from a Chinese OEM we haven't seen devices from before called Xiaomi, but is a surprisingly decent performer and has one of the most unique (and surprisngly speedy) skins I've ever seen on Android.
Vellamo Test Breakdown
Vellamo's test are divided into a few categories, and start with Rendering tests which stress the performance of HTML5 <canvas> elements. Although Vellamo at present exists on Android as a standalone application, the tests themselves are entirely HTML and JavaScript and run inside Android WebView views which use the Android WebKit browser and whatever optimizations have been made by the OEM. Vellamo as an application simply exists around the tests to measure FPS, dropped frames, time, and report scores.
First among these tests is See the Sun Canvas, which renders increasingly demanding stages of a 2D rotating butterfly in an HTML5 <canvas> element. The first stage starts out with cubes, then moves to circles, then circles of different color, and finally alpha-blended for the maximum load.
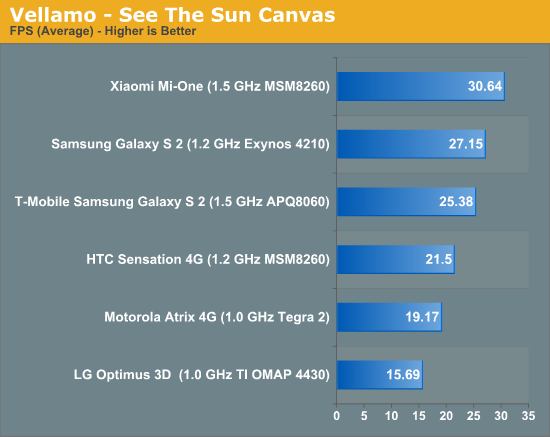
The Xiaomi Mi-One is a new device for us, but delivers strikingly fast performance thanks to the work that Xiaomi has done to the stock Android browser. I found the SGS2's backing store pretty decent as well, but you can see how much difference there is in performance between the two despite packing the same 1.5 GHz dual core snapdragon (APQ8060 and MSM8260 differ solely in baseband - APQ lacks one).
The next test is Deep Sea Canvas which tests almost the same parameters as See the Sun, except tests are non-sequential here and are an attempt to fully load the platform.
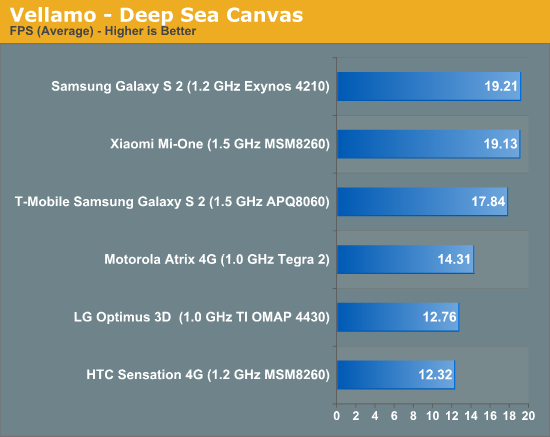
Interestingly enough, Exynos 4210 comes out on top of the pack.
Next up is Aquarium canvas which tests the number of HTML5 canvas objects that can be rendered simultaneously. In addition, this test runs in a native Android Java implementation for comparison with the HTML5 <canvas> implementation in the browser.
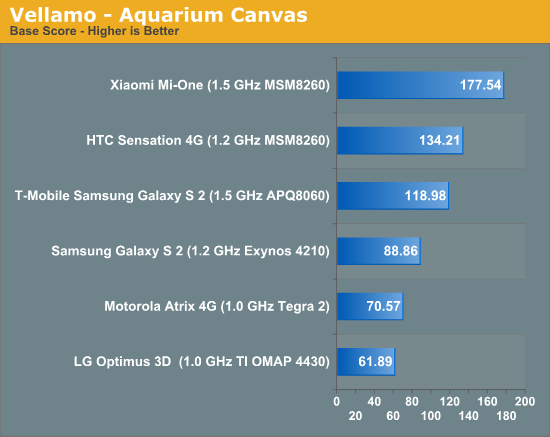
Vellamo calculates a score for each subtest alongside FPS and dropped frames, and we've chosen to report FPS wherever possible, but this test makes more sense being reported in base score. Interestingly enough the Sensation 4G edges out the faster T-Mobile SGS2.
Pixel Blender is next which draws multiple images over a static background and applies alpha blending. Vellamo calculates the graphics throughput of the browser in pixels per second to arrive at memory bandwidth for blitting and blending.
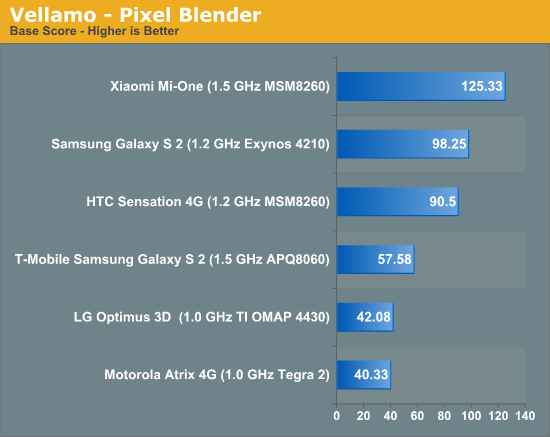
Again there's a pretty shocking disparity between Samsung's browser and the Xiaomi, we're reporting the base score here as well.
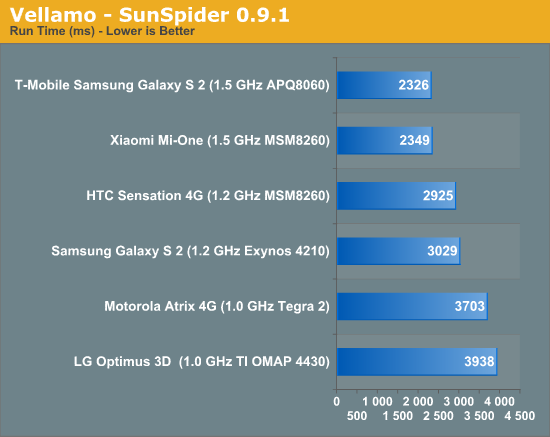
Next up are the very familiar JavaScript VM tests which we've taken a look at many times before in numerous reviews. In Android's case, every browser is using the V8 JavaScript engine. First among these tests is SunSpider 0.9.1. We started using 0.9 and have moved to 0.9.1 for most things now, which still consists of a number of relatively short tests run 10 times. The final product is a completion time in milliseconds, and thusly lower is better. SunSpider is developed by the WebKit team of course.
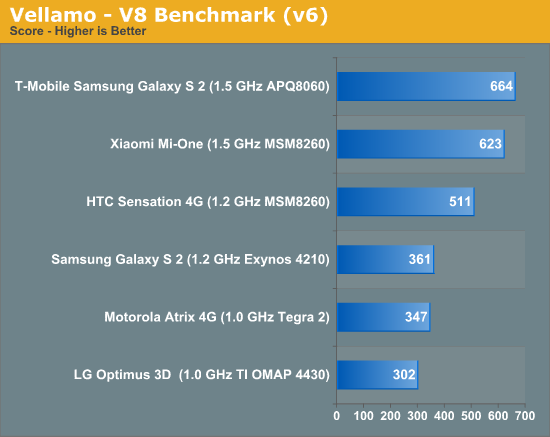
SunSpider is to WebKit as the V8 benchmark suite is to, well, V8. It's another JavaScript benchmark which consists of a number of beefy tests (raytracing, regex, math, e.t.c.) and also exercises the VM's garbage collector. Vellamo runs v6 of the V8 benchmark which is latest.
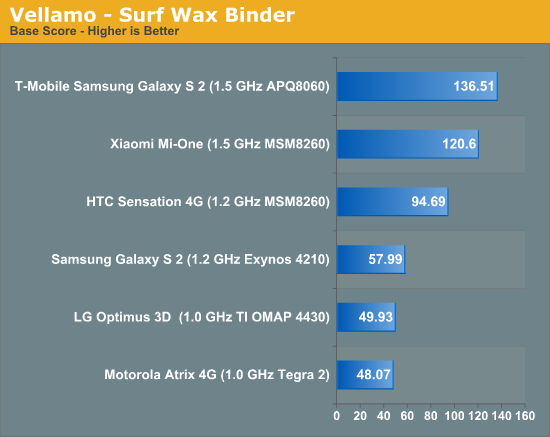
Next is SurfWax Binder, which measures the efficiency of JavaScript bindings code which links the VM to the rest of the browser's core and rendering core. It consists of a long series of nested function calls, which Vellamo measures in number of accesses per second.
Where I feel Vellamo really shines however is this next suite, which we've shown scores from before, and this is the User Experience Test category. This is the area that until now has proven challenging to qualitate without using video or other subjective measures - things like scrolling performance and responsiveness.
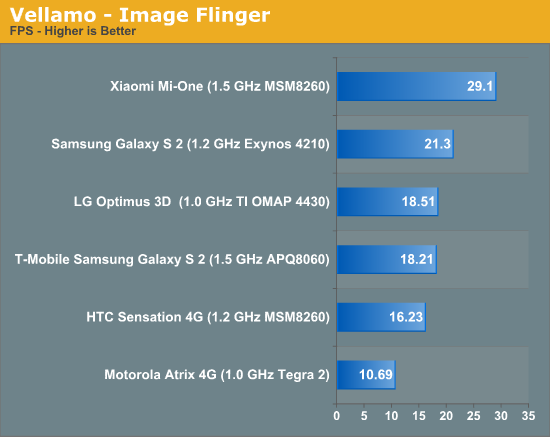
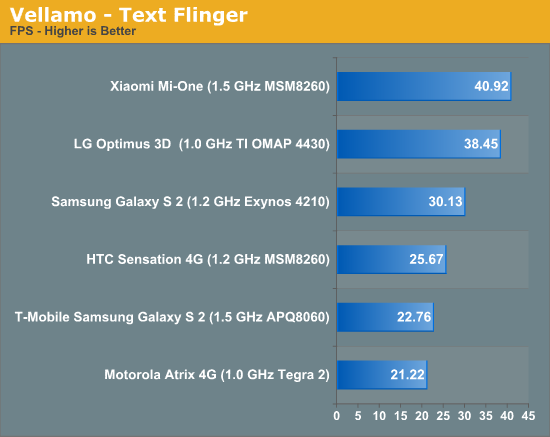
There are three tests here, starting with Ocean Flinger, which measures user experience when scrolling a page in a flinging manner. This is a test which consists of sample text, images, CSS, and JavaScript. ImageFlinger is a similar test which takes a dense grid of repeated JPEG images and scrolls it. Finally Text Flinger does the same thing, but with a repeated grid of densely packed text. We've reported Ocean Flinger in other tests before since it really is a combination of images and text (like we've already stated).
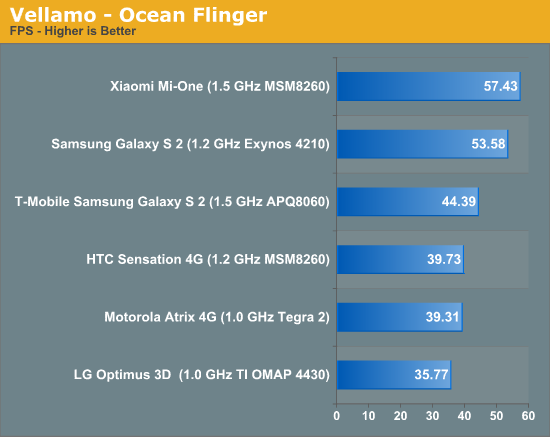
I have to admit that Vellamo's numbers here closely mirror my own subjective scrolling performance perceptions when using the respective devices. The three scrolling tests represent a way to finally codify one of the more elusive (and yet easily perceptible) browser performance aspects.
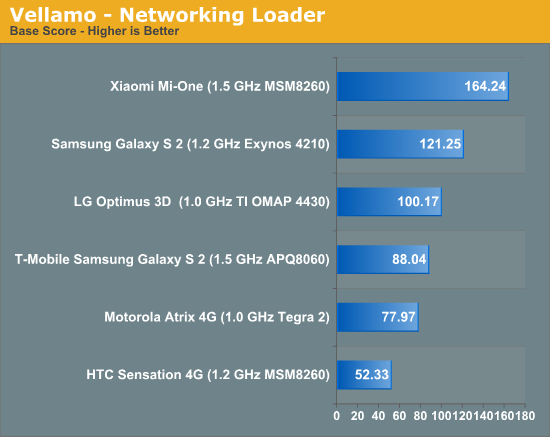
The final test is a networking loader suite which loads a page stored locally and times how long it takes in milliseconds. This is done in both hot and cold mode (with the caches cleared and not cleared) and is designed to test local performance.
Finally Vellamo also reports a total score which is a summation of all the base scores from each subtest.
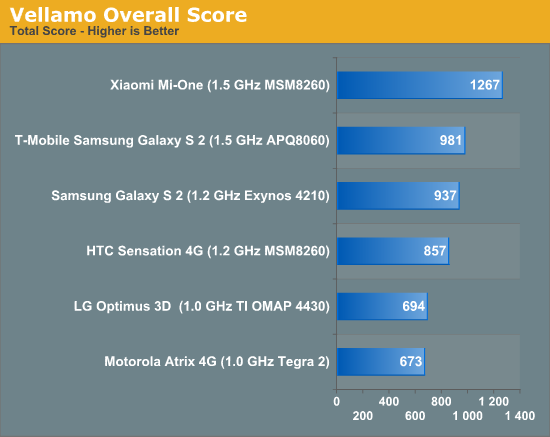
The total score subjectively lines up with where I would mentally rank the devices - we've seen how competent Samsung's browser optimizations are (especially their browser's backing store), and how much sometimes HTC's Sense tends to weigh the platform down. Motorola's browser on the Atrix and LG's on the Optimus 3D take a more stock approach, and the Xiaomi surprises us with some serious optimizations from a company I doubt many in the US have heard of.
We're going to be adding (and simultaneously giving the same treatment) a few more benchmarks in preparation for a revamped testing suite for 2012 and an updated smartphone Bench as well.


82 Comments
View All Comments
catnaps - Thursday, November 17, 2011 - link
Yeah, don't worry about the 300Mhz difference, lol.I just ran this on my Sensation (rooted, ARHD 3.6, Bricked kernel) at 1.5Ghz and surprise surprise, it bested the SGS2 with a score of 1055. No, it's not stock kernel but that's a significant improvement; too much for just the kernel alone.
catnaps - Thursday, November 17, 2011 - link
1.2Ghz score: 884.So no, it's not the kernel, it's the 20% speed increase.
georgekn3mp - Wednesday, November 16, 2011 - link
Well it looks like my 4G signal strength on HTC Rezound sucked at work...much better results on wifi ;) well less apps running too.4G WIFI
See the Sun Canvas: 56.66 / 63.76
Deep Sea Canvas: 87.68 / 118.46
Aquarium Canvas: 83.59 / 131.65
Pixel Blender: 104 / 108.41
Surf Wax Binder: 127.02 / 128.33
Sun Spider: 2316 / 2357
V8 Benchmark: 696 / 708
Ocean Flinger: 49.46 / 50.23
Image Flinger: 18.1 / 18.15
Text Flinger: 36.54 / 37.17
Networking Loader: 82.72 / 86.88
Overall Score: 883 / 967
6th overall of 31 tested running 2.3.4 / 2nd on list on later run
georgekn3mp - Wednesday, November 16, 2011 - link
Well it looks like my 4G signal strength on HTC Rezound sucked at work...much better results on wifi ;) well less apps running too.
4G WIFI
See the Sun Canvas: 56.66 / 63.76
Deep Sea Canvas: 87.68 / 118.46
Aquarium Canvas: 83.59 / 131.65
Pixel Blender: 104 / 108.41
Surf Wax Binder: 127.02 / 128.33
Sun Spider: 2316 / 2357
V8 Benchmark: 696 / 708
Ocean Flinger: 49.46 / 50.23
Image Flinger: 18.1 / 18.15
Text Flinger: 36.54 / 37.17
Networking Loader: 82.72 / 86.88
Overall Score: 883 / 967
6th overall of 31 tested running Gingerbread 2.3.4 / 2nd on list on later run
HTC Rezound Quadrant score - 2450
NenaMark1 - 53.3 fps
NenaMark2 - 35.8 fps
Speedtest - 4g 25685 kbps down / 12122 kbps up
wifi-N 6146 kbps down / 1173 kbps up
joemtoney - Wednesday, November 16, 2011 - link
1113 Overall Score On my captivate at 1.44Ghz, silly dual core processors1 :d 2.3.7 is better!MarkAroundTheWorld - Thursday, November 17, 2011 - link
It looks like it's more a function of which sub-version of Android than hardware platform or even perhaps OEM optimizations.I was surprised to see my 1.5 year old phone reach 2nd on the list.
Vibrant (Galaxy S) on CM7.1 @1.3GHz
Platypus Kernel + SmartAssV2 Gov
Total Score: 1003
I wonder how the Galaxy Nexus will do... launch dammit!
pSupaNova - Friday, November 18, 2011 - link
Looks like you are correct. Scroll down to section :- Powerful web browsing.http://www.android.com/about/ice-cream-sandwich/
Its a good thing MUI is already intergrating the ICS framework into it ROM.
Lucian Armasu - Thursday, November 17, 2011 - link
How fair do you think this benchmark really is Brian? I'm a little worried by the fact that it's made by someone who has a horse in the game - Qualcomm. Wouldn't that mean they will prioritize testing whatever Qualcomm chips are good at? That kind of lowers the credibility of the benchmark.I think they did it before with Neocore, where if I remember correctly Adreno 200 was scoring better than PowerVR SGX535, and yet I never saw a game that looked better on Adreno 200 than one on PowerVR SGX535 around that time.
BenSkywalker - Thursday, November 17, 2011 - link
Besides being a Qualcomm benchmark, it also uses the default Android browser. I get the impression that noone at AT actually uses an Android device for themselves. This does seem like another Neocore- check out the results they have built in to the benchmark- the GalaxyS2 finished behind the Desire, the Galaxy 2 LTE however finishes quite a bit higher while the Xperia Arc leaves all of those phones behind. I don't know if this was supposed to be a PR piece that Brian was authoring for Qualcomm or something else entirely, but worthy of a tech site article? Certainly not.Mr Alpha - Thursday, November 17, 2011 - link
What about the new Futuremark Peacekeeper Beta? As I understand it it is supposed to support both mobile and desktop browsers and comes with a wide range of tests.