OCZ RevoDrive 3 X2 (480GB) Preview: 200K IOPS & 1.5GB/s for $1699?
by Anand Lal Shimpi on June 28, 2011 12:00 PM EST- Posted in
- Storage
- SSDs
- SandForce
- OCZ
- RevoDrive
- SF-2000
- RevoDrive 3
- RevoDrive 3 X2
AnandTech Storage Bench 2011
Last year we introduced our AnandTech Storage Bench, a suite of benchmarks that took traces of real OS/application usage and played them back in a repeatable manner. I assembled the traces myself out of frustration with the majority of what we have today in terms of SSD benchmarks.
Although the AnandTech Storage Bench tests did a good job of characterizing SSD performance, they weren't stressful enough. All of the tests performed less than 10GB of reads/writes and typically involved only 4GB of writes specifically. That's not even enough exceed the spare area on most SSDs. Most canned SSD benchmarks don't even come close to writing a single gigabyte of data, but that doesn't mean that simply writing 4GB is acceptable.
Originally I kept the benchmarks short enough that they wouldn't be a burden to run (~30 minutes) but long enough that they were representative of what a power user might do with their system.
Not too long ago I tweeted that I had created what I referred to as the Mother of All SSD Benchmarks (MOASB). Rather than only writing 4GB of data to the drive, this benchmark writes 106.32GB. It's the load you'd put on a drive after nearly two weeks of constant usage. And it takes a *long* time to run.
1) The MOASB, officially called AnandTech Storage Bench 2011 - Heavy Workload, mainly focuses on the times when your I/O activity is the highest. There is a lot of downloading and application installing that happens during the course of this test. My thinking was that it's during application installs, file copies, downloading and multitasking with all of this that you can really notice performance differences between drives.
2) I tried to cover as many bases as possible with the software I incorporated into this test. There's a lot of photo editing in Photoshop, HTML editing in Dreamweaver, web browsing, game playing/level loading (Starcraft II & WoW are both a part of the test) as well as general use stuff (application installing, virus scanning). I included a large amount of email downloading, document creation and editing as well. To top it all off I even use Visual Studio 2008 to build Chromium during the test.
The test has 2,168,893 read operations and 1,783,447 write operations. The IO breakdown is as follows:
| AnandTech Storage Bench 2011 - Heavy Workload IO Breakdown | ||||
| IO Size | % of Total | |||
| 4KB | 28% | |||
| 16KB | 10% | |||
| 32KB | 10% | |||
| 64KB | 4% | |||
Only 42% of all operations are sequential, the rest range from pseudo to fully random (with most falling in the pseudo-random category). Average queue depth is 4.625 IOs, with 59% of operations taking place in an IO queue of 1.
Many of you have asked for a better way to really characterize performance. Simply looking at IOPS doesn't really say much. As a result I'm going to be presenting Storage Bench 2011 data in a slightly different way. We'll have performance represented as Average MB/s, with higher numbers being better. At the same time I'll be reporting how long the SSD was busy while running this test. These disk busy graphs will show you exactly how much time was shaved off by using a faster drive vs. a slower one during the course of this test. Finally, I will also break out performance into reads, writes and combined. The reason I do this is to help balance out the fact that this test is unusually write intensive, which can often hide the benefits of a drive with good read performance.
There's also a new light workload for 2011. This is a far more reasonable, typical every day use case benchmark. Lots of web browsing, photo editing (but with a greater focus on photo consumption), video playback as well as some application installs and gaming. This test isn't nearly as write intensive as the MOASB but it's still multiple times more write intensive than what we were running last year.
As always I don't believe that these two benchmarks alone are enough to characterize the performance of a drive, but hopefully along with the rest of our tests they will help provide a better idea.
The testbed for Storage Bench 2011 has changed as well. We're now using a Sandy Bridge platform with full 6Gbps support for these tests. All of the older tests are still run on our X58 platform.
AnandTech Storage Bench 2011 - Heavy Workload
We'll start out by looking at average data rate throughout our new heavy workload test:
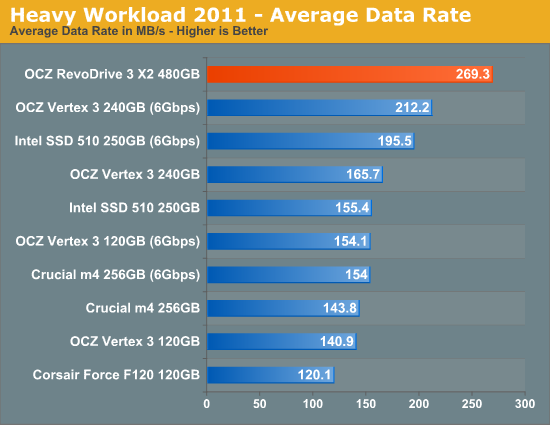
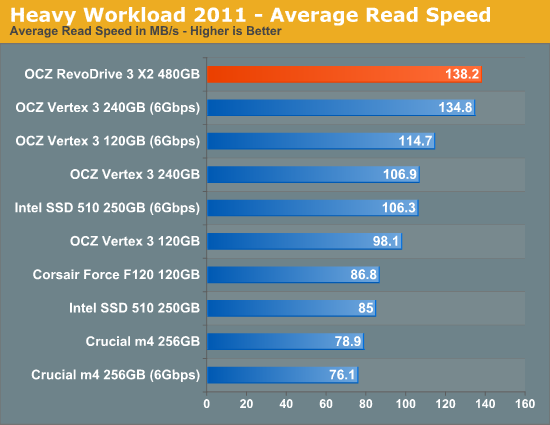
Average performance in our Heavy workload is improved over a single Vertex 3, but not tremendously. Where we really see a tremendous performance increase is when we look at the breakdown of reads/writes:
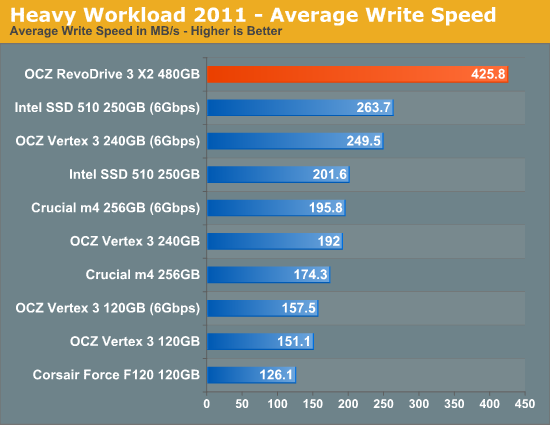
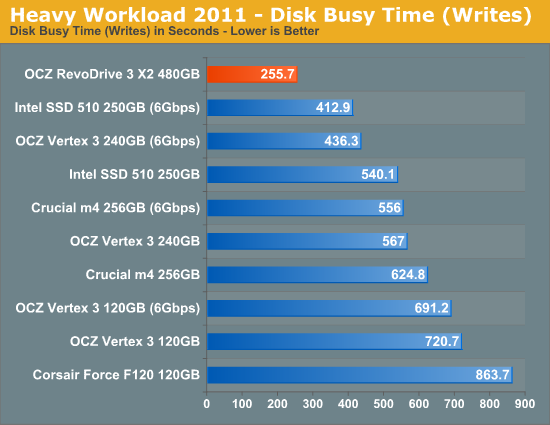
Write speed is much improved over a single 240GB Vertex 3. It's not quite the improvement you'd expect from a 4-controller configuration, but I'd expect that this is the sort of performance improvement most workstation users would see.
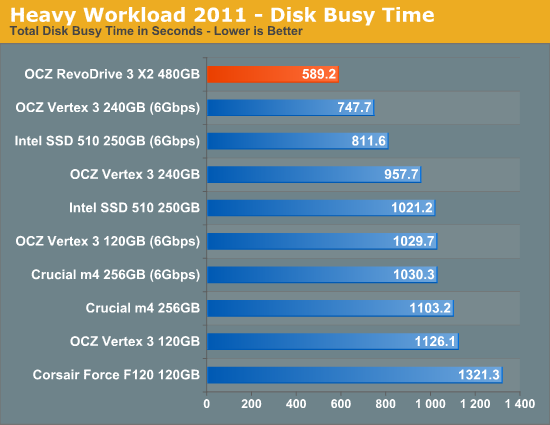
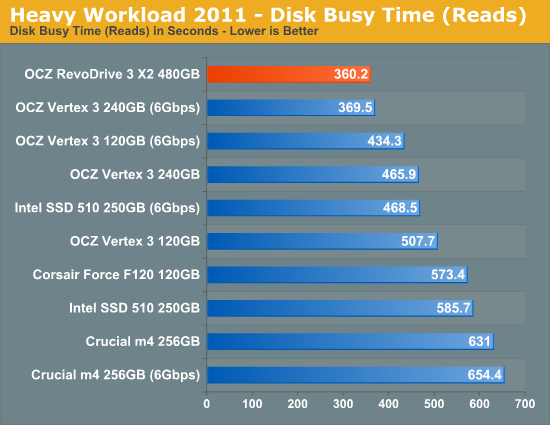
The next three charts just represent the same data, but in a different manner. Instead of looking at average data rate, we're looking at how long the disk was busy for during this entire test. Note that disk busy time excludes any and all idles, this is just how long the SSD was busy doing something:


38 Comments
View All Comments
GullLars - Thursday, June 30, 2011 - link
This card will get decimated by even an 80GB ioDrive, not to mention the 320GB ioDrive Duo, in just about any real world scenario. They are designed from completely different standpoints.While both are highly parallell, the ioDrive is highly optimized for latency and can push close to 20.000 4KB random read IOPS (~75-80MB/s) at a QD of 1, while Revodrive 3 x2 reaches 13K at QD 3, and around 4-5K at QD 1.
The ioDrive also handles mixed IO well, and scales really fast at low block sizes and queue depths, so you would need incredibly heavy parallell workloads to keep it at a notable QD (>10).
What bothers me the most with the Revodrive 3 x2 is that it doesn't implement an onboard cache at all. With 64-512MB you could use it for read-ahead and hit those GB/s+ seq bandwidth numbers at a QD of 1 for fairly small block sizes.
With a (super?)capacitor you could also safely use say 8-16MB of that cache for write buffering and saturate the array.
GullLars - Thursday, June 30, 2011 - link
Correction, RevoDrive 3 x2 benched 7K 4KB random read IOPS @ QD 1 in AS SSD.Jharne - Tuesday, June 28, 2011 - link
The INF mentions VEN_11AB & VEN_1B4B which are both Marvell. So I'm guessing they built the controller.DigitalFreak - Tuesday, June 28, 2011 - link
LOL. All the trouble they go through to hide the controller vendor and all you need to do is look at the vendor IDVStrom - Tuesday, June 28, 2011 - link
You can boot with this on x64 with an unsigned driver...you just need to load Windows with the signed driver validation disabled (F8 before Windows loads).DanNeely - Tuesday, June 28, 2011 - link
If you need to do this before every boot it's a non-option in the server world. In normal operation no keyboard/mouse/monitor will be attached, all interaction will be via remote desktop type services after it's booted.VStrom - Tuesday, June 28, 2011 - link
True, but I was referring to Andand's comment specifically about Win 7 saying "Windows 7 x64 won't boot off of the RevoDrive 3". When this ships, the driver will be ready and a non-issue for servers.bacomatic - Tuesday, September 13, 2011 - link
Apparently this has been fixed, I am booting Win 7 x64 from this drive with the current drivers.quiksilvr - Tuesday, June 28, 2011 - link
I would have figured with this strong staple in the 2.5" SSD market with TRIM enabled devices this would not be hard to to.mikeblas - Tuesday, June 28, 2011 - link
Comparing this device against consumer-level SSDs seems like a waste of time. Why not compare against fusionio?I'd also like to see a benchmark that runs for a sustained period. The problem with SSD is the ability to keep up with write loads. If you run the 4K random IO benchmark for 48 hours, does the IOPS rate spike or trend downwards, or does it stay flat? The write ratio of your benchmark is around 33%, which I don't think represents OLTP applications too well.
The review doesn't comment on the stability of the drivers, their memory usage on the host, or the management and monitoring tools for the drive. Do I get a tool that measures remaps, does SNMP, or email alerting?