Westmere-EX: Intel's Flagship Benchmarked
by Johan De Gelas on May 19, 2011 1:30 PM EST- Posted in
- IT Computing
- Intel
- Xeon
- Cloud Computing
- Westmere-EX
Power Extremes: Idle and Full Load
Idle and full load power measurements are hardly relevant for virtualized environments but they offer some interesting datapoints. In the first test we report the power consumption running vApus Mark II, which means that the servers are working at 85-98% CPU load. We measured with four tiles, but we also tested the Xeon with five tiles (E7-4870 5T).
We test with redundant power supplies working, so the Dell R815 uses 1+1 1100W PSUs and the QSSC-4R uses 2+2 850W PSU. Remember that the QSSC server has cold redundant PSUs, so the redundant PSUs consume almost nothing. There's more to the story than just the PSU and performance, of course: the difference in RAS features, chassis options, PSU, and other aspects of the overall platform can definitely impact power use, and that's unfortunately something that we can't easily eliminate from the equation.
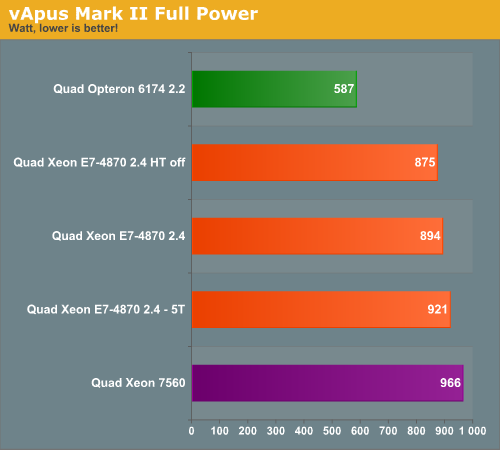
The Quad E7-4870 Xeons save about 7.5% power (894 vs 966) compared to their older brothers. The power consumption numbers look very bad compared to the AMD system in absolute terms. However, with five tiles the Quad Xeon E7 delivers 63% higher performance while consuming 57% more power. We can conclude that at very high loads, the Xeon E7 performance/watt ratio is quite competitive.
When we started testing at idle, we test with both the Samsung 1333MHz 4GB 1.35V (low power) DDR3 registered (M393B5273DH0) and 1.5V DIMMs (M393B5170FH0-H9).
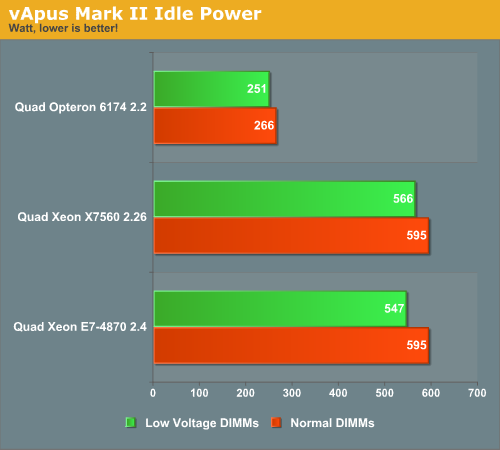
Despite the fact that the Xeon X7560 does not support low power DIMMs officially, it was able to save about 5% of the total power use. The Xeon E7's more advanced memory controller was able to reduce power by 8%. But the picture is clear: if your servers runs idle for large periods of time, the quad Opteron server is able to run on a very low amount of power, while the quad Xeon server needs at least 600W if you do not outfit it with low power 1.35V DIMMs. How much of the power difference comes from the platform in general and how much is specific to the servers being tested is unfortunately impossible to say without testing additional servers.
As we have stated before, maximum power and minimum power are not very realistic, so let us check out our real world scenario.


62 Comments
View All Comments
Soulnibbler - Thursday, May 26, 2011 - link
Hey I'm thinking of building up a multicore box for raw processing. I'm wondering if you could benchmark bibble on these supercore systems.Preferably with an A900 or a 5dmkII
Also using the wavelet denoise and wavelet sharpening plugins as these are what I use most often.
I'm wondering about import and preview speed and also speed to export as jpg.
Let me know if its possible to do these benchmarks, also if you need source files and config sets I have some 8-16gig sets.
JohanAnandtech - Thursday, May 26, 2011 - link
Questions: are you sure bibble can handle enough threads? And can you provide me with a benchmarkable scenario? mail me at Johan AT anandtech