The Intel SSD 510 Review
by Anand Lal Shimpi on March 2, 2011 1:23 AM EST- Posted in
- IT Computing
- Storage
- SSDs
- Intel
- Intel SSD 510
The X25-M was a tremendous first attempt by Intel to get into the SSD market. In our review of the SSD I wrote that Intel just Conroe’d the SSD market, and if it weren’t for the pesky 80MB/s sequential write speed limitation the X25-M would’ve been given the title: World’s Fastest Drive.
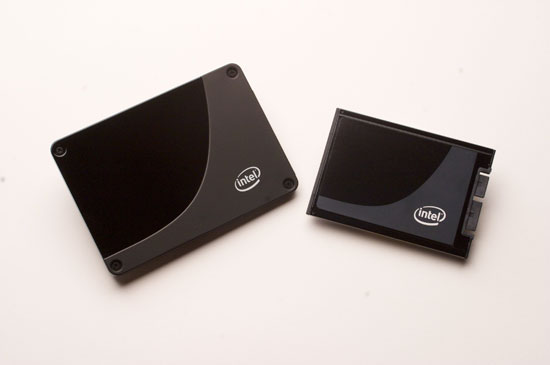
Its successor, the X25-M G2, was a mild update that brought prices down through the use of 34nm NAND. Remember that Intel is also 49% owner of the IMFT joint venture and as a result can be quite competitive on NAND pricing (and quite early to adopt new NAND technologies).
Intel’s goal all along was to drive down the cost of SSDs. Looking at the history of MSRPs with the X25-M (not to mention the M, which stood for Mainstream in the product name) this shouldn’t come as a surprise:
| Intel X25-M Pricing History | |||||
| 2008 | 2009 | ||||
| 40GB | - | $125 | |||
| 80GB | $595 | $225 | |||
| 160GB | $1000+ | $440 | |||
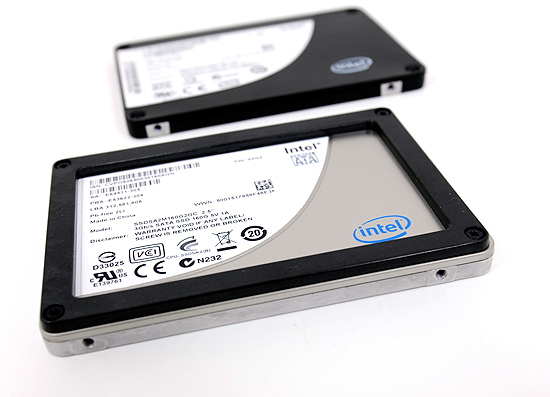
The third generation X25-M was to drive down costs even further, this time thanks to Intel’s 25nm NAND. You’d be able to get twice the capacity at the same price point as the X25-M G2. The value drive would be an 80GB offering, the mainstream drive would be 160GB and the high end drive would be 320GB.
The drive would offer higher performance. The controller was to be completely redesigned, with the “oversight” that limited sequential write speed to only 100MB/s corrected entirely. In addition, the third generation Intel SSD would add full disk encryption - making it even better suited for enterprise customers. Going after the enterprise market was Intel’s plan to really make money on SSDs in the long run. Instead of just selling corporations a CPU, chipset and wireless controller in a notebook, there would be an SSD on top of all of that. Perhaps eventually even have some security software courtesy of McAfee.
The third generation X25-M was originally due out in the middle of 2010. As is usually the case with schedules, the “G3” slipped. The middle of the year became the end of the year and the end of the year became Q1 2011.
To make matters worse, the specifications Intel was talking about for its third generation drive/controller weren’t all that competitive. We published the details last year knowing that the competition would do better. Intel’s redesigned controller was late and underperforming. Internally, Intel knew it had a problem.
Intel aimed for the majority of the market with the X25-M, it had set its sights on lowering cost, but it left the high performance enthusiast market entirely uncared for. A void that SandForce filled quite nicely with its unique brand of controllers.
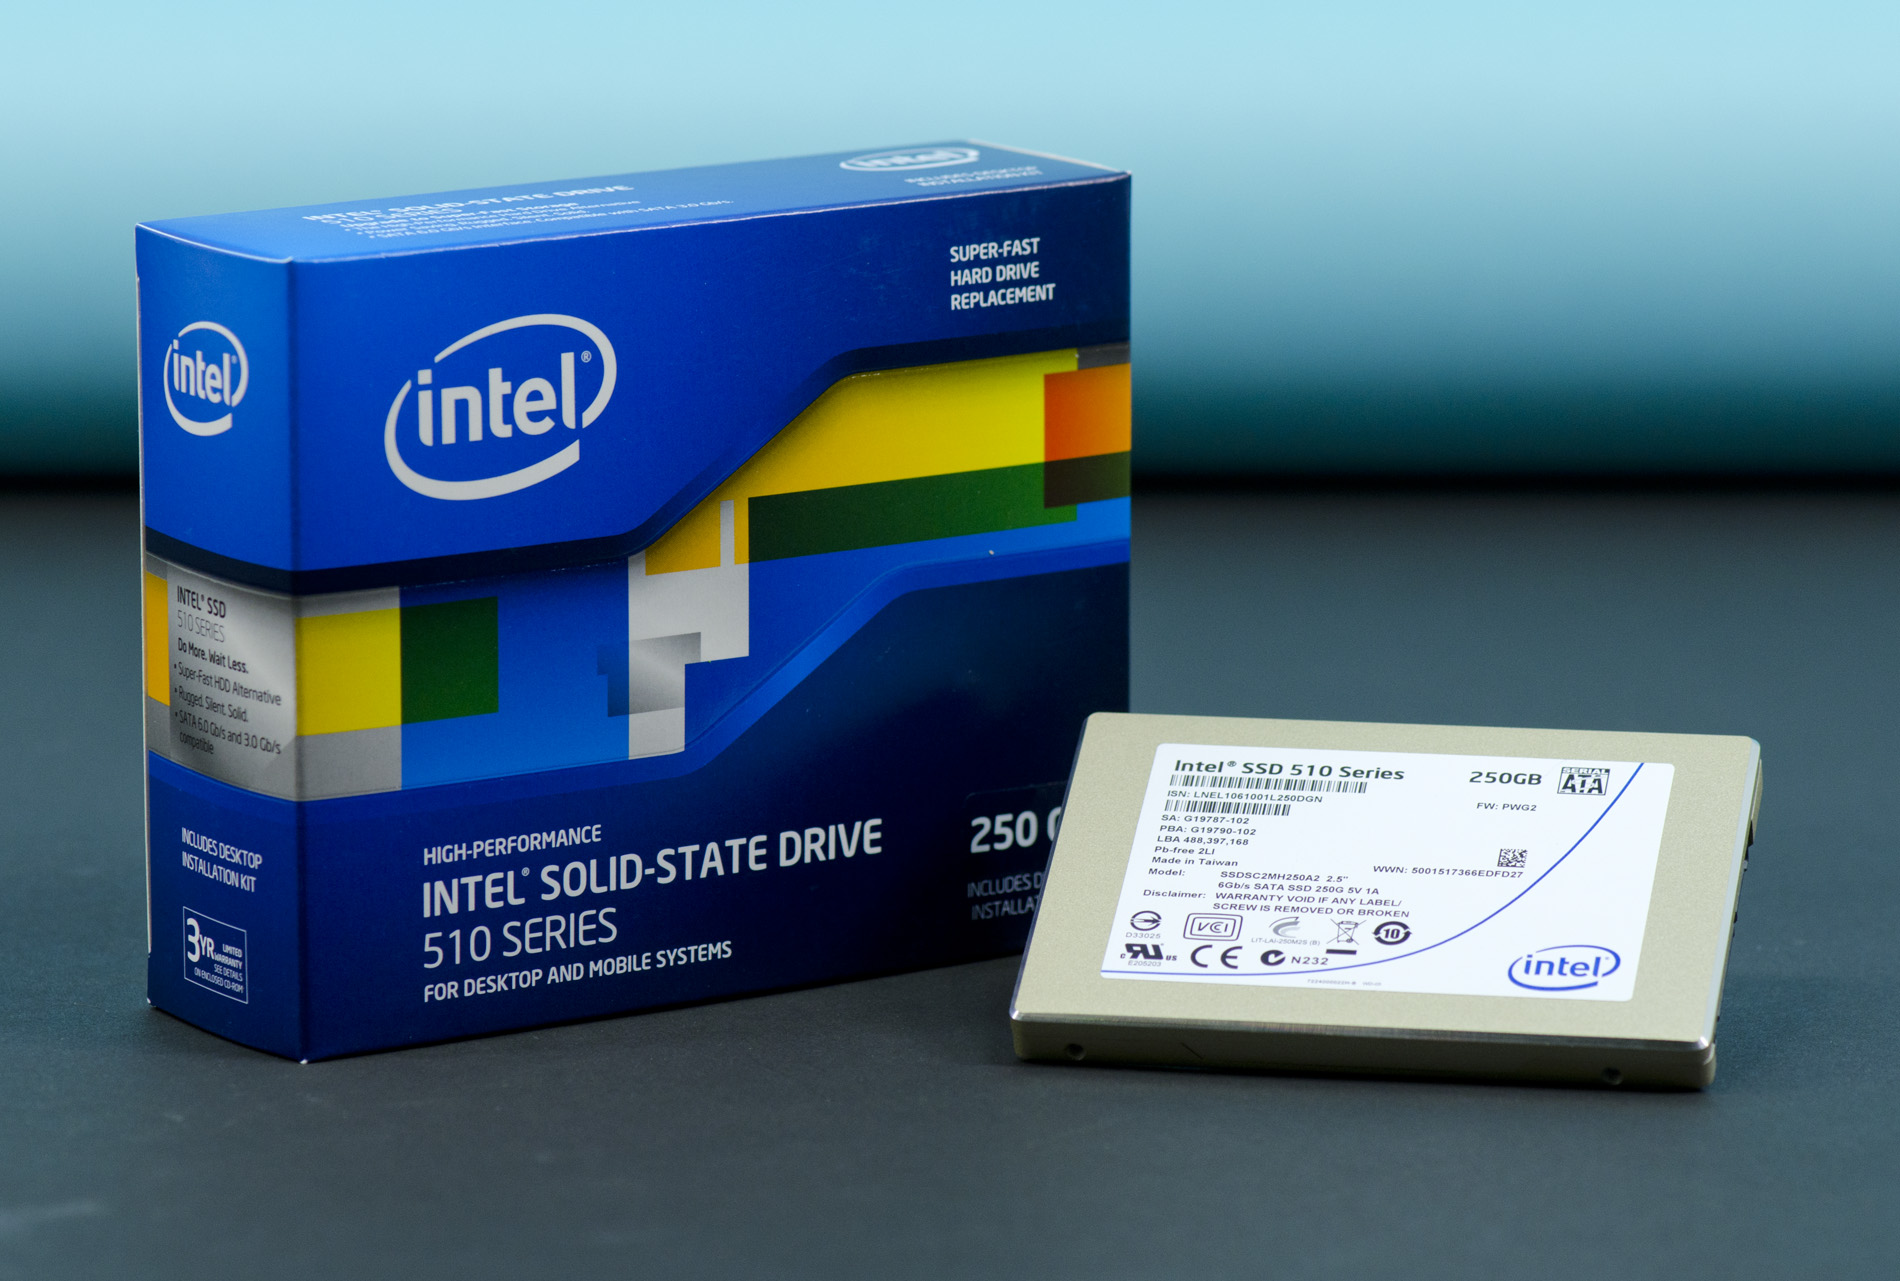
With a hole in the roadmap and an unwillingness to cede complete control of the high end market to SandForce, Intel did the unthinkable: developed a new SSD based on a competing controller technology.


128 Comments
View All Comments
masterkritiker - Wednesday, March 2, 2011 - link
When will we be able to buy $100+ SSDs @ 1TB capacity?gammaray - Wednesday, March 2, 2011 - link
nevertno - Thursday, March 3, 2011 - link
+1Nihility - Thursday, March 3, 2011 - link
At least 4 years.ionis - Wednesday, March 2, 2011 - link
It would be nice if some HDDs were also included in workload benches. They were in the random read/write benches so I don't get why they were left out of the other ones.dagamer34 - Wednesday, March 2, 2011 - link
HDDs aren't included because they'd throw off the scale pretty horribly. The number labeling the performance would be larger than the bar itself compared to all the other SSDs out there.ionis - Thursday, March 3, 2011 - link
I find that hard to believe, considering they were included in the random read/write graphs at 1/100 or less of the performance of some of the SSDs and the charts weren't scaled horribly.In the sequential reads/writes, they performed at 25%-80% which doesn't through the scale off much at all.
The heavy workload looked to involve a lot of sequential access (installs and downloads). So again, I don't see why they weren't included.
There are also other comments asking for more HDDs in the benches. For people like myself, who didn't start following storage benchmarks until SSDs came out, it's hard to tell what the performance gain is.
ionis - Thursday, March 3, 2011 - link
I find that hard to believe, considering they were included in the random read/write graphs at 1/100 or less of the performance of some of the SSDs and the charts weren't scaled horribly.In the sequential reads/writes, they performed at 25%-80% which doesn't throw the scale off much at all.
The heavy workload looked to involve a lot of sequential access (installs and downloads). So again, I don't see why they weren't included.
There are also other comments asking for more HDDs in the benches. For people like myself, who didn't start following storage benchmarks until SSDs came out, it's hard to tell what the performance gain is.
(sorry if double post, comment didn't seem to show up 1st time)
mateus1987 - Wednesday, March 2, 2011 - link
now you know.http://nzealander.blog.com/files/2011/03/6661.jpg
mateus1987 - Wednesday, March 2, 2011 - link
the satanic Apple logo.http://nzealander.blog.com/files/2011/03/6661.jpg