The Intel SSD 510 Review
by Anand Lal Shimpi on March 2, 2011 1:23 AM EST- Posted in
- IT Computing
- Storage
- SSDs
- Intel
- Intel SSD 510
AnandTech Storage Bench 2011: Much Heavier
I didn't expect to have to debut this so soon, but I've been working on updated benchmarks for 2011. Last year we introduced our AnandTech Storage Bench, a suite of benchmarks that took traces of real OS/application usage and played them back in a repeatable manner. I assembled the traces myself out of frustration with the majority of what we have today in terms of SSD benchmarks.
Although the AnandTech Storage Bench tests did a good job of characterizing SSD performance, they weren't stressful enough. All of the tests performed less than 10GB of reads/writes and typically involved only 4GB of writes specifically. That's not even enough exceed the spare area on most SSDs. Most canned SSD benchmarks don't even come close to writing a single gigabyte of data, but that doesn't mean that simply writing 4GB is acceptable.
Originally I kept the benchmarks short enough that they wouldn't be a burden to run (~30 minutes) but long enough that they were representative of what a power user might do with their system.
Not too long ago I tweeted that I had created what I referred to as the Mother of All SSD Benchmarks (MOASB). Rather than only writing 4GB of data to the drive, this benchmark writes 106.32GB. It's the load you'd put on a drive after nearly two weeks of constant usage. And it takes a *long* time to run.
I'll be sharing the full details of the benchmark in some upcoming SSD articles but here are some details:
1) The MOASB, officially called AnandTech Storage Bench 2011 - Heavy Workload, mainly focuses on the times when your I/O activity is the highest. There is a lot of downloading and application installing that happens during the course of this test. My thinking was that it's during application installs, file copies, downloading and multitasking with all of this that you can really notice performance differences between drives.
2) I tried to cover as many bases as possible with the software I incorporated into this test. There's a lot of photo editing in Photoshop, HTML editing in Dreamweaver, web browsing, game playing/level loading (Starcraft II & WoW are both a part of the test) as well as general use stuff (application installing, virus scanning). I included a large amount of email downloading, document creation and editing as well. To top it all off I even use Visual Studio 2008 to build Chromium during the test.
Many of you have asked for a better way to really characterize performance. Simply looking at IOPS doesn't really say much. As a result I'm going to be presenting Storage Bench 2011 data in a slightly different way. We'll have performance represented as Average MB/s, with higher numbers being better. At the same time I'll be reporting how long the SSD was busy while running this test. These disk busy graphs will show you exactly how much time was shaved off by using a faster drive vs. a slower one during the course of this test. Finally, I will also break out performance into reads, writes and combined. The reason I do this is to help balance out the fact that this test is unusually write intensive, which can often hide the benefits of a drive with good read performance.
There's also a new light workload for 2011. This is a far more reasonable, typical every day use case benchmark. Lots of web browsing, photo editing (but with a greater focus on photo consumption), video playback as well as some application installs and gaming. This test isn't nearly as write intensive as the MOASB but it's still multiple times more write intensive than what we were running last year.
As always I don't believe that these two benchmarks alone are enough to characterize the performance of a drive, but hopefully along with the rest of our tests they will help provide a better idea.
The testbed for Storage Bench 2011 has changed as well. We're now using a Sandy Bridge platform with full 6Gbps support for these tests. All of the older tests are still run on our X58 platform.
AnandTech Storage Bench 2011 - Heavy Workload
We'll start out by looking at average data rate throughout our new heavy workload test:
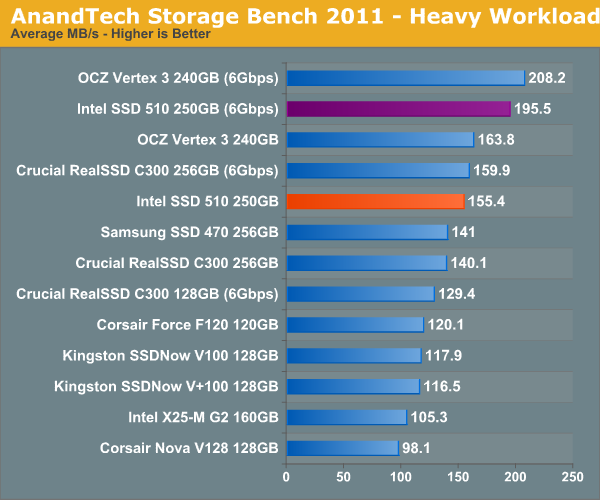
There's simply no dethroning the Vertex 3, but Intel's SSD 510 does come dangerously close. Over a 6Gbps interface the 510 delivers 93% of the performance of the Vertex 3. Over a 3Gbps interface the gap narrows to a meager 5.2%.
The breakdown of reads vs. writes tells us more of what's going on:
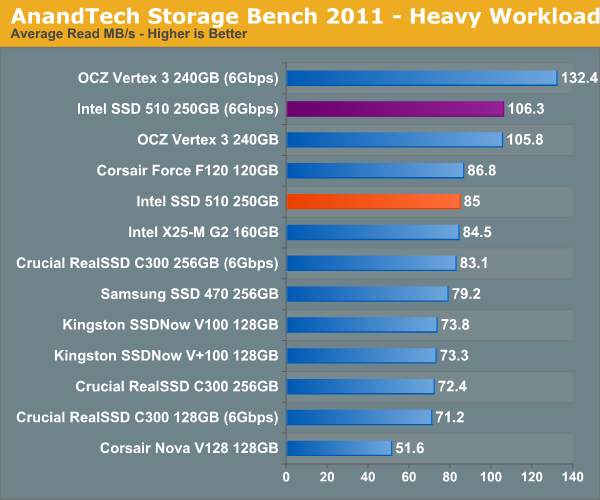
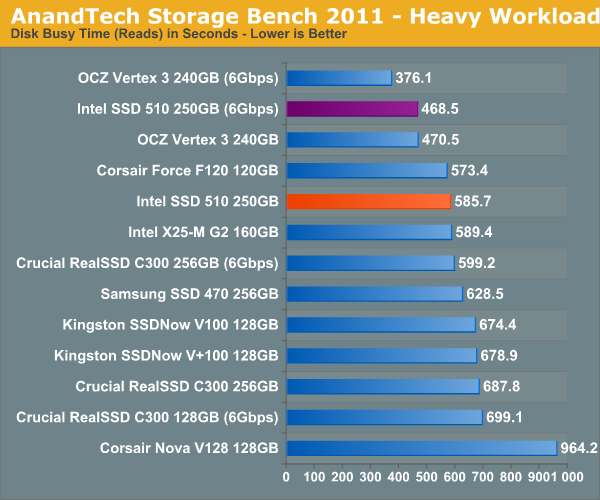
The Vertex 3 is nearly 25% faster than the 510 if we just isolate the reads conducted by our benchmark. Remember the poor random read performance? I suspect that's at play here. The Intel SSD 510 on a 6Gbps interface is about the speed of the Vertex 3 on a 3Gbps port.
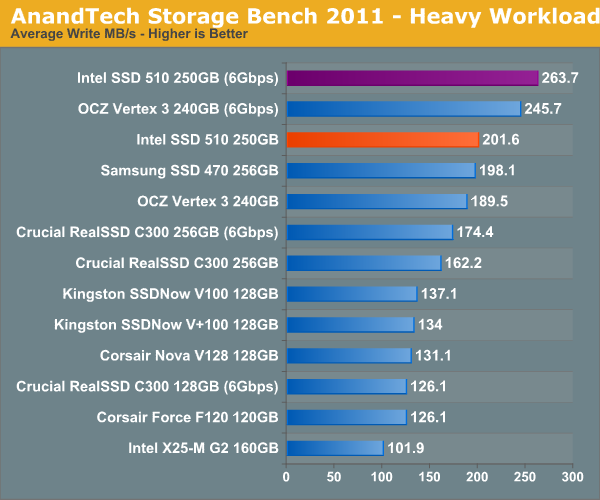
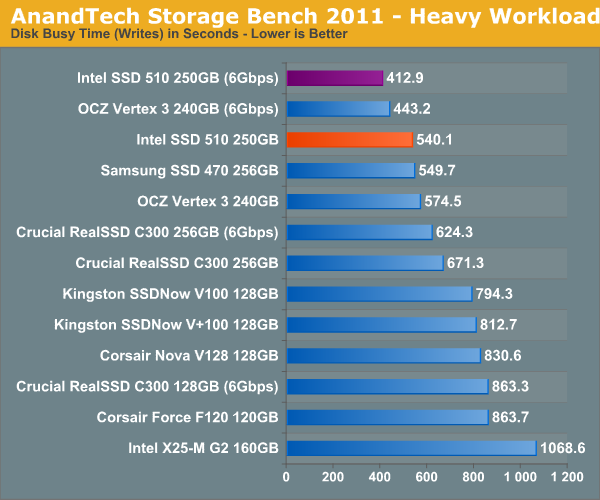
Ah ha! This is where the picture shifts. Our heavy workload does have a significant amount of incompressible writes which significantly reduce the performance of the Vertex 3. The V3 loses enough ground that the 510 is 7% faster in writes during our benchmark.
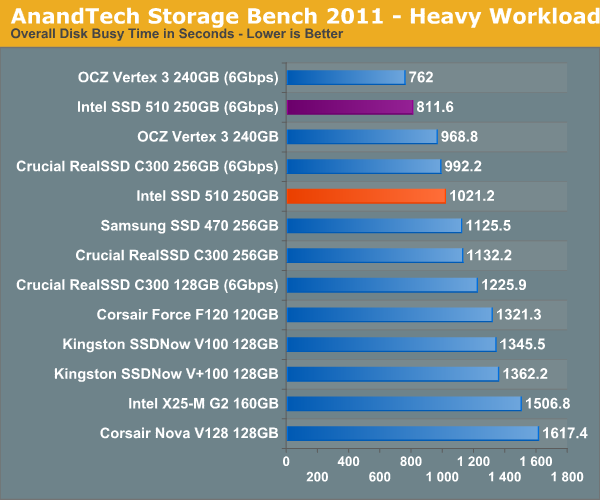
The next three charts just represent the same data, but in a different manner. Instead of looking at average data rate, we're looking at how long the disk was busy for during this entire test. Note that disk busy time excludes any and all idles, this is just how long the SSD was busy doing something:


128 Comments
View All Comments
Squuiid - Friday, March 4, 2011 - link
+1They were the 1st of this next gen to be available, yet NOBODY has reviewed them.
Based on the 2nd Gen Marvel controller I believe, a' la C400.
Luke212 - Friday, March 4, 2011 - link
Anand,I am looking to implement SSDs in Application servers and I need to know how they go in Raid 1 over time. Noone seems to test this! So I am stuck with magnetic drives!!
sean.crees - Friday, March 11, 2011 - link
Anyone else notice the Samsung 470 near or at the top of most benchmarks on a 3gb controller? Is this the SSD in current Macbook Pro's? I havn't seen a review posted to Anandtech about this specific device.daidaloss - Tuesday, March 15, 2011 - link
I'm curious as to how does this SSD drive stacks up when compared to this unit SATA2 DDR2 HyperDrive5 from http://www.hyperossystems.co.uk/.Maybe sometime in the future, Anand will consider this RAM drive.
tygrus - Wednesday, May 11, 2011 - link
Not specific to Intel 510 SSD:Sequential performance after several full disk GB rewrites ?
The LBA remapping for wear levelling must make more of the disk look random (not sequential) after every block has been re-written several times. It's a torture test to see how it can handle reading large files that have been spread over several non-sequential NAND blocks. Or does it not matter as much because the controller can optimise access to several NAND dies at once? Does it only remap 512KB at a time or does the 512KB blocks have non-sequential 4KB LBA's written to them?
Does SSD performance approach random R/W performance after long term heavy use ?
gaffe - Tuesday, October 11, 2011 - link
Just an anonymous tip. I happen to know this data is wildly inaccurate because my friend is a reliability engineer at a major company.WHY DON'T YOU DO A SMALL RELIABILITY TEST OF YOUR OWN TO SEE FOR YOURSELF HOW UNLIKELY IT IS THAT THIS DATA IS ACCURATE.
It seems you have tested probably 20 SSDs for your reviews. So, how many of them have failed on you during testing? How many during the course of the past 3 years? What's the failure rate average across all manufacturers?
Even though manufacturers probably send you their best tested units for review, and your sample size is small, etc. I am willing to bet you REAL MONEY that the failure rate will be more than 3% even in a sample size of just 20.
How about we buy 20 SSDs today and in 3 years see who is right, loser buys em all, winner gets em (you can keep the failed ones)?
Any takers?
gaffe - Tuesday, October 11, 2011 - link
Oh and P.S.You forgot to mention above that failure rates are generally PER YEAR. So that's a 3% chance it fails EACH YEAR. And it's still wrong by double or triple (it's closer to 9%).
gaffe - Tuesday, October 11, 2011 - link
Sorry to keep piling on, but it bothers me so much that this inaccurate data is out there and people are believing this that I also want to mention this data does not even say which models were tested. This is probably all enterprise grade drives that does not even apply to consumers that are reading this article, and, as I said above, it's STILL INACCURATE!