OCZ Vertex 3 Pro Preview: The First SF-2500 SSD
by Anand Lal Shimpi on February 17, 2011 3:01 AM ESTThe Test
Note that I've pulled out our older results for the Kingston V+100. There were a couple of tests that had unusually high performance which I now believe was due the drive being run with a newer OS/software image than the rest of the older drives. I will be rerunning those benchmarks in the coming week.
I should also note that this is beta hardware running beta firmware. While the beta nature of the drive isn't really visible in any of our tests, I did attempt to use the Vertex 3 Pro as the primary drive in my 15-inch MacBook Pro on my trip to MWC. I did so with hopes of exposing any errors and bugs quicker than normal, and indeed I did. Under OS X on the MBP with a full image of tons of data/apps, the drive is basically unusable. I get super long read and write latency. I've already informed OCZ of the problem and I'd expect a solution before we get to final firmware. Often times actually using these drives is the only way to unmask issues like this.
| CPU |
Intel Core i7 965 running at 3.2GHz (Turbo & EIST Disabled) Intel Core i7 2600K running at 3.4GHz (Turbo & EIST Disabled) - for AT SB 2011 |
| Motherboard: |
Intel DX58SO (Intel X58) Intel H67 Motherboard |
| Chipset: |
Intel X58 + Marvell SATA 6Gbps PCIe Intel H67 |
| Chipset Drivers: |
Intel 9.1.1.1015 + Intel IMSM 8.9 Intel 9.1.1.1015 + Intel RST 10.2 |
| Memory: | Qimonda DDR3-1333 4 x 1GB (7-7-7-20) |
| Video Card: | eVGA GeForce GTX 285 |
| Video Drivers: | NVIDIA ForceWare 190.38 64-bit |
| Desktop Resolution: | 1920 x 1200 |
| OS: | Windows 7 x64 |
Random Read/Write Speed
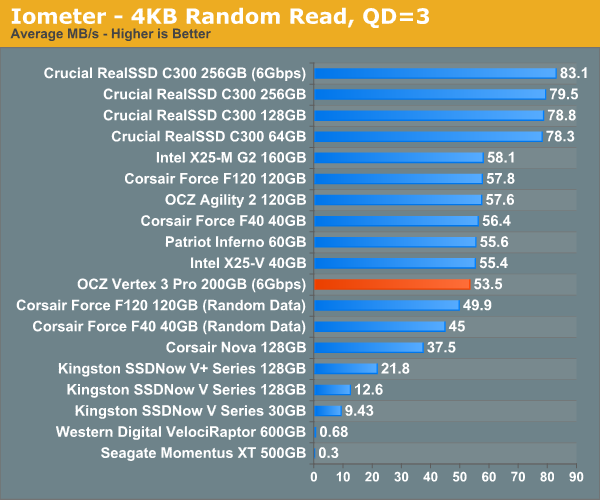
The four corners of SSD performance are as follows: random read, random write, sequential read and sequential write speed. Random accesses are generally small in size, while sequential accesses tend to be larger and thus we have the four Iometer tests we use in all of our reviews.
Our first test writes 4KB in a completely random pattern over an 8GB space of the drive to simulate the sort of random access that you'd see on an OS drive (even this is more stressful than a normal desktop user would see). I perform three concurrent IOs and run the test for 3 minutes. The results reported are in average MB/s over the entire time. We use both standard pseudo randomly generated data for each write as well as fully random data to show you both the maximum and minimum performance offered by SandForce based drives in these tests. The average performance of SF drives will likely be somewhere in between the two values for each drive you see in the graphs. For an understanding of why this matters, read our original SandForce article.
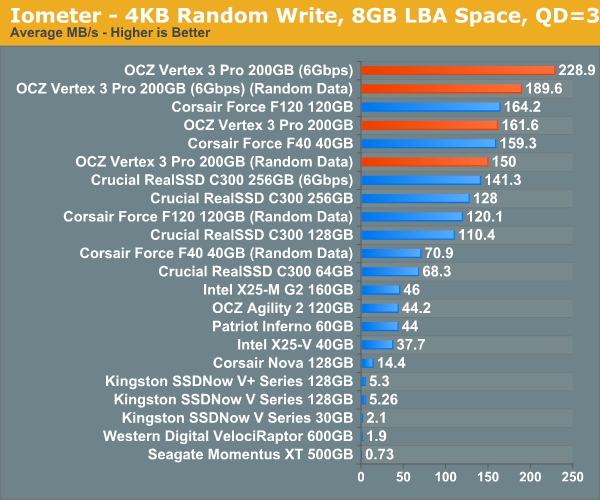
Random write performance is much better on the SF-2500, not that it was bad to begin with on the SF-1200. In fact, the closest competitor is the SF-1200, the rest don't stand a chance.
Many of you have asked for random write performance at higher queue depths. What I have below is our 4KB random write test performed at a queue depth of 32 instead of 3. While the vast majority of desktop usage models experience queue depths of 0 - 5, higher depths are possible in heavy I/O (and multi-user) workloads:
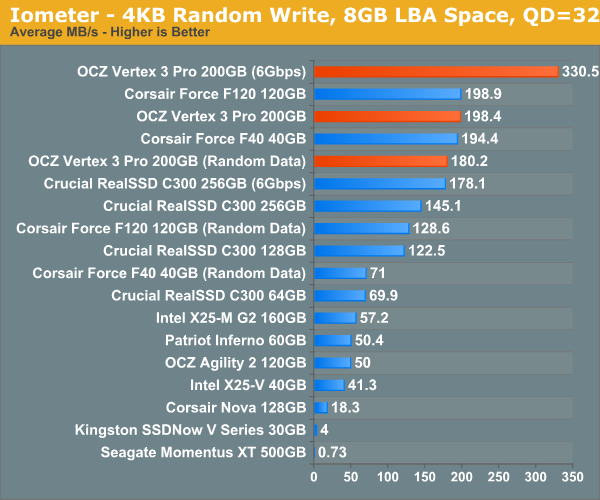
Ramp up the queue depth and there's still tons of performance on the table. At 3Gbps the performance of the Vertex 3 Pro is actually no different than the SF-1200 based Corsair Force, the SF-2500 is made for 6Gbps controllers.


144 Comments
View All Comments
cgorange - Thursday, February 17, 2011 - link
Anand,Is there some reason that the Samsung 470-series wasn't included on all charts?
Diosjenin - Thursday, February 17, 2011 - link
"Paired with a decent SSD controller, write lifespan is a non-issue. Note that I only fold Intel, Crucial/Micron/Marvell and SandForce into this category."So did you deliberately or accidentally leave out Indilinx?
Chloiber - Thursday, February 17, 2011 - link
Of course he couldn't include all the controllers, only those which he tested thorougly. So I'm pretty sure he left them out deliberately because there are so many broken drives from Indilinx. My 32GB drive also went down the drain. Maybe it was also part of the many, MANY broken firmwares they released. But even if you trust their SMART values, the write amplification on those drives is VERY high.Mr Perfect - Thursday, February 17, 2011 - link
I'm glad to see a component review on AT again, even if it's just a preview. It has been feeling like Engaget or some other phone review site around here.cactusdog - Thursday, February 17, 2011 - link
haha i know, they seem to like phones these days.MrBrownSound - Thursday, February 17, 2011 - link
nice to see that the intel x-25m still is in the ranks of the new generation drives.I bought a intel x25-m 160GB and booted my OS right away without reformating. Will it suffer performance loss?
ajp_anton - Thursday, February 17, 2011 - link
Your "x GB drive appears as y GB in Windows" look very much like GB<->GiB conversion errors.deadrock01 - Thursday, February 17, 2011 - link
Anand,Any possibility of getting the OCZ Revo PCI Express Cards and other SSD-like items in the SSD benchmark list?
marraco - Thursday, February 17, 2011 - link
^^^that.ilkhan - Thursday, February 17, 2011 - link
Numbers look real nice.For someone on a budget looking for a 120GB (or close enough) SSD on a 3Gbps controller, whats the recommendation. Wait for the new drives, grab a corsair force, else?