OCZ Vertex 3 Pro Preview: The First SF-2500 SSD
by Anand Lal Shimpi on February 17, 2011 3:01 AM ESTAnandTech Storage Bench 2011: Much Heavier
I didn't expect to have to debut this so soon, but I've been working on updated benchmarks for 2011. Last year we introduced our AnandTech Storage Bench, a suite of benchmarks that took traces of real OS/application usage and played them back in a repeatable manner. I assembled the traces myself out of frustration with the majority of what we have today in terms of SSD benchmarks.
Although the AnandTech Storage Bench tests did a good job of characterizing SSD performance, they weren't stressful enough. All of the tests performed less than 10GB of reads/writes and typically involved only 4GB of writes specifically. That's not even enough exceed the spare area on most SSDs. Most canned SSD benchmarks don't even come close to writing a single gigabyte of data, but that doesn't mean that simply writing 4GB is acceptable.
Originally I kept the benchmarks short enough that they wouldn't be a burden to run (~30 minutes) but long enough that they were representative of what a power user might do with their system.
Not too long ago I tweeted that I had created what I referred to as the Mother of All SSD Benchmarks (MOASB). Rather than only writing 4GB of data to the drive, this benchmark writes 106.32GB. It's the load you'd put on a drive after nearly two weeks of constant usage. And it takes a *long* time to run.
I'll be sharing the full details of the benchmark in some upcoming SSD articles (again, I wasn't expecting to have to introduce this today so I'm a bit ill prepared) but here are some details:
1) The MOASB, officially called AnandTech Storage Bench 2011 - Heavy Workload, mainly focuses on the times when your I/O activity is the highest. There is a lot of downloading and application installing that happens during the course of this test. My thinking was that it's during application installs, file copies, downloading and multitasking with all of this that you can really notice performance differences between drives.
2) I tried to cover as many bases as possible with the software I incorporated into this test. There's a lot of photo editing in Photoshop, HTML editing in Dreamweaver, web browsing, game playing/level loading (Starcraft II & WoW are both a part of the test) as well as general use stuff (application installing, virus scanning). I included a large amount of email downloading, document creation and editing as well. To top it all off I even use Visual Studio 2008 to build Chromium during the test.
Many of you have asked for a better way to really characterize performance. Simply looking at IOPS doesn't really say much. As a result I'm going to be presenting Storage Bench 2011 data in a slightly different way. We'll have performance represented as Average MB/s, with higher numbers being better. At the same time I'll be reporting how long the SSD was busy while running this test. These disk busy graphs will show you exactly how much time was shaved off by using a faster drive vs. a slower one during the course of this test. Finally, I will also break out performance into reads, writes and combined. The reason I do this is to help balance out the fact that this test is unusually write intensive, which can often hide the benefits of a drive with good read performance.
There's also a new light workload for 2011. This is a far more reasonable, typical every day use case benchmark. Lots of web browsing, photo editing (but with a greater focus on photo consumption), video playback as well as some application installs and gaming. This test isn't nearly as write intensive as the MOASB but it's still multiple times more write intensive than what we were running last year.
As always I don't believe that these two benchmarks alone are enough to characterize the performance of a drive, but hopefully along with the rest of our tests they will help provide a better idea.
The testbed for Storage Bench 2011 has changed as well. We're now using a Sandy Bridge platform with full 6Gbps support for these tests. All of the older tests are still run on our X58 platform.
AnandTech Storage Bench 2011 - Heavy Workload
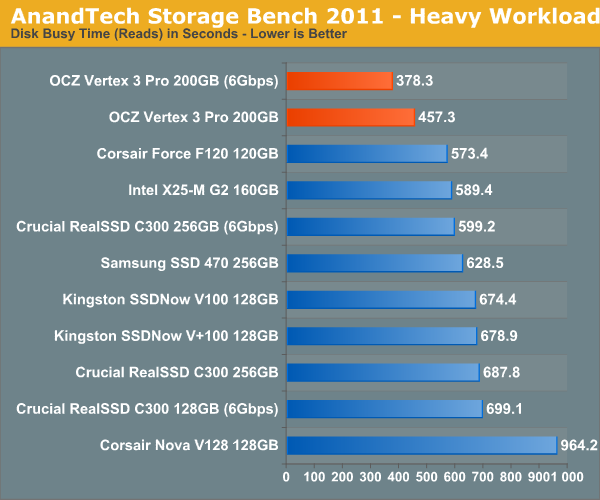
We'll start out by looking at average data rate throughout our new heavy workload test:
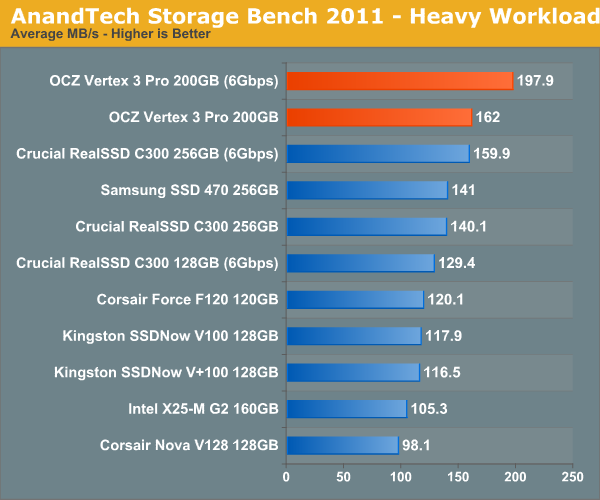
The Vertex 3 Pro on a 6Gbps interface is around 24% faster than Crucial's RealSSD C300. Note that the old SF-1200 (Corsair Force F120) can only deliver 60% of the speed of the new SF-2500. Over a 3Gbps interface the Vertex 3 Pro is quick, but only 15% faster than the next fastest 3Gbps drive. In order to get the most out of the SF-2500 you need a 6Gbps interface.
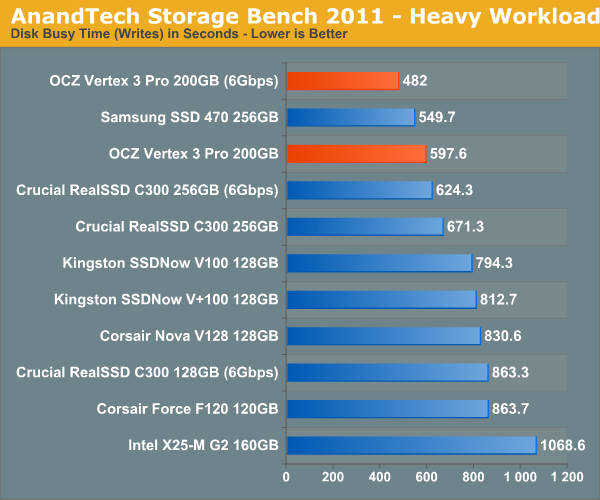
If we break out our performance results into average read and write speed we get a better idea for the Vertex 3 Pro's strengths:
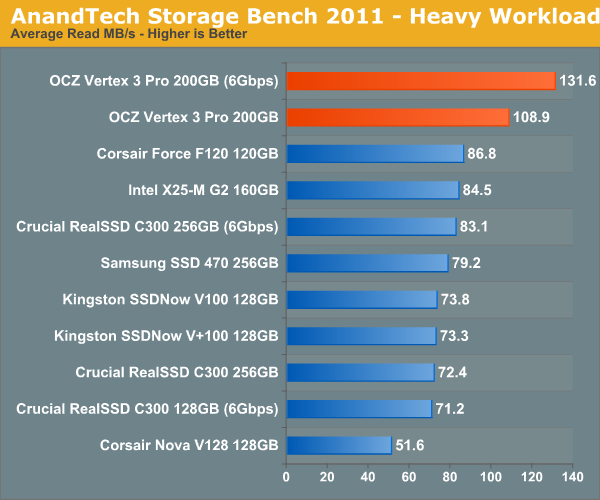
The SF-2500 is significantly faster than its predecessor and all other drives in terms of read performance. Good read speed is important as it influences application launch time as well as overall system responsiveness.
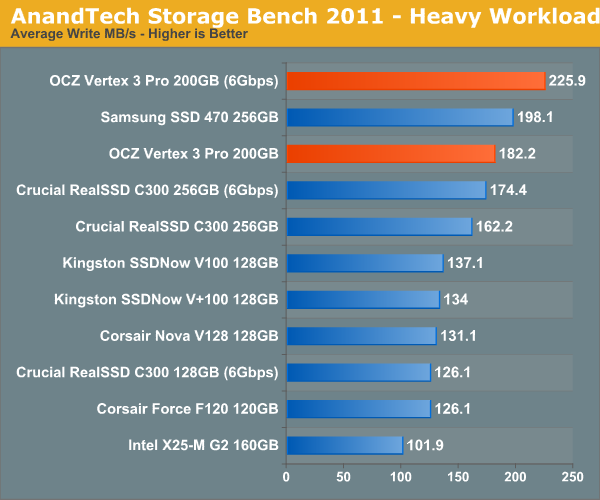
Average write speed is still class leading, but this benchmark uses a lot of incompressible data - you'll note that the Vertex 3 Pro only averages 225.9MB/s - barely over its worst case write speed. It's in this test that I'm expecting the new C400 to do better than SandForce.
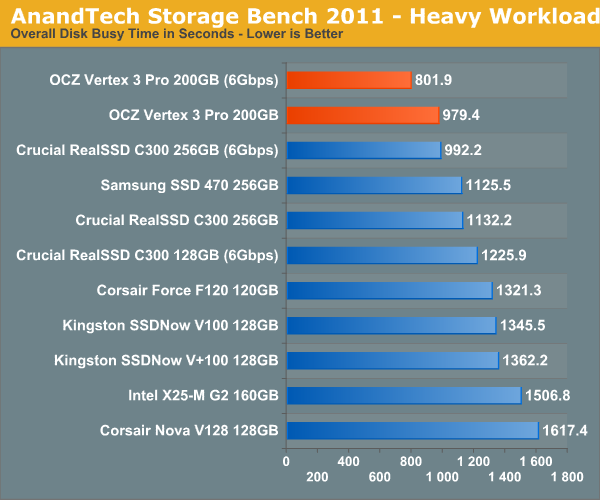
The next three charts just represent the same data, but in a different manner. Instead of looking at average data rate, we're looking at how long the disk was busy for during this entire test. Note that disk busy time excludes any and all idles, this is just how long the SSD was busy doing something:


144 Comments
View All Comments
FCss - Thursday, February 17, 2011 - link
"My personal desktop sees about 7GB of writes per day." maybe a stupid question but how do you check the amount of your daily writes?And one more question: if you have a 128Gb SSD and you leave let's say 40Gb unformated so the user can't fill up the disk, will the controller use this space the same way as it would belong to the spare area?
Quindor - Thursday, February 17, 2011 - link
I use a program called "HDDLED" for this. It shows you some easily accessible leds on your screen and if you hover over it, you can see the current and total disk usage since your PC was booted up.FCss - Thursday, February 17, 2011 - link
thanks, a great softwareBreit - Thursday, February 17, 2011 - link
isn't the totally written bytes to the drive since manufacturing be part of the smart data you can read from your drive? all you have to do then is noting down the value when you boot up your pc in the morning and subtract that from the actual value you read there the next day.Chloiber - Thursday, February 17, 2011 - link
Or you can just take the average..marraco - Thursday, February 17, 2011 - link
Vertex 2 takes advantage of unformated space. So OCZ advices to leave 20% of space unformated , (although to improve garbage collection, but it means that unformated space is used)7Enigma - Thursday, February 17, 2011 - link
Comon Anand! In your example you have 185GB free on a 256GB drive. I think that is the least likely scenario that paints an overly optimistic case in terms of write life. Everyone knows not to completely fill up their drive but are you telling me that the vast majority of users are going to have 78% of their drive free at all times? I just don't buy it.The more common scenario is that a consumer purchases a drive slightly larger then needed (due to how expensive these luxuries still are). So that 256GB drive probably will only have 20-40GB free. Do that and that 36 days for a single use of the NAND becomes ~5-8 days (no way to move static data around at this capacity level). Factor in write amplification (0.6X to 10X) and you lower the time to between 4-25 years for hitting that 3000X cap.
Still not a HUGE problem, but much more relevant then saying this drive will last for hundreds of years (not counting NAND lifespan itself).
7Enigma - Thursday, February 17, 2011 - link
Bah I thought the write amplification was 1.6X. That changes the numbers considerably (enough that the point is moot). I still think the example in the article was not a normal circumstance but it seems to still not be an issue.<pie to face>
mark53916 - Thursday, February 17, 2011 - link
Encrypted files are not compressible, so you won't get any advantagefrom the hardware write compression.
7Enigma - Thursday, February 17, 2011 - link
Hi Anand,Looks like one of the numbers is incorrect in this chart. Right now it shows LOWER performance after TRIM then when the drive was completely full. The 230MB/sec value seems to be incorrect.