LG Optimus 2X & NVIDIA Tegra 2 Review: The First Dual-Core Smartphone
by Brian Klug & Anand Lal Shimpi on February 7, 2011 3:53 AM EST- Posted in
- Smartphones
- Tegra 2
- LG
- Optimus 2X
- Mobile
- NVIDIA
Performance Analysis
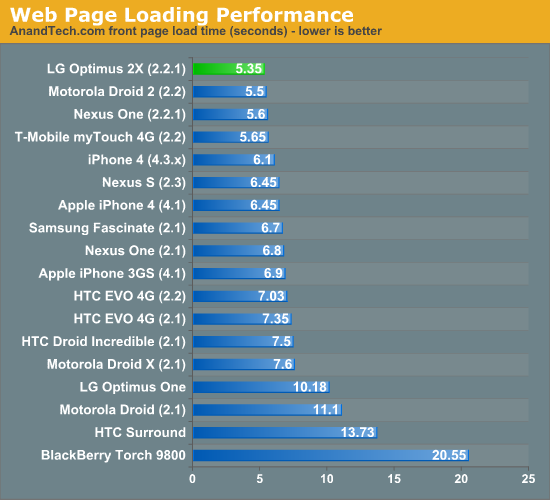
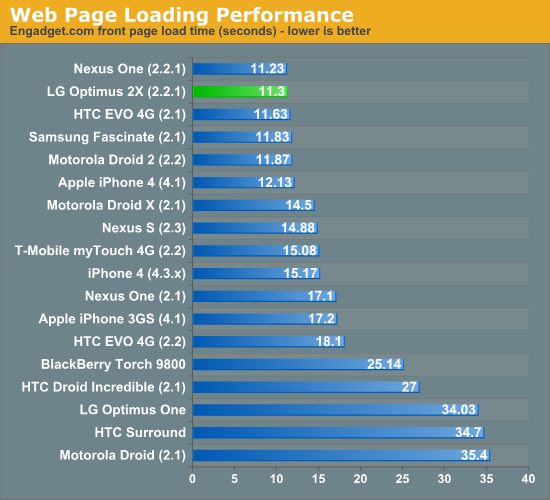
Android’s browser is multithreaded, but again certain workloads and pages lend themselves to parallelization much better than others. When it comes to our page load suite, the 2X is almost class leading, though our results are starting to get very cramped and clustered among the same grouping of Android versions. All of the Android browsers in these tests have Flash enabled as well. Anand and I are working on setting up a much more comprehensive and sophisticated page load test with much better repeatability, as the current version has become a bit unwieldy. Expect to see that soon, but for now we're using the old method.
 ;
;
Panning and zooming on the 2X is speedy, even if it’s still choppier than the Galaxy S’ hardware accelerated browser. What’s really noticeable on the 2X is how fast Adobe Flash is. Generally while browsing I can feel when Flash ads are really slowing a page down—the 2X almost never felt that way. The 2X was running Flash version 10.1.120.10 which is newer than the version available in the market at current writing. The Flash version in the market has a number of warnings cautioning against installing the current market version on the 2X or a Tegra 2 powered phone as only the preloaded version has Tegra 2 optimizations. Thankfully these are being rolled into the next market release so there won’t be any Flash version fragmentation.
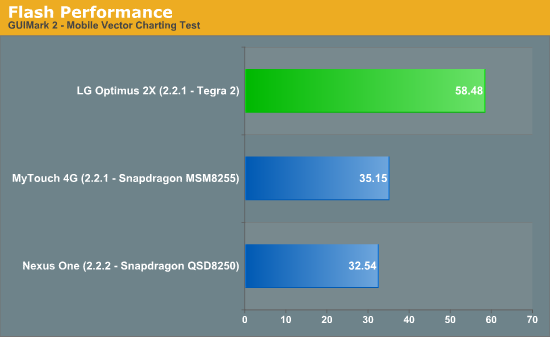
We tested with GUIMark2’s mobile Flash charting test which has a nice framerate counter and test mode. The results speak for themselves, Flash feels dramatically faster on here than any other platform we’ve tested. We still don't have a Galaxy S device with 2.2 officially on it, and therefore don't have a comparison from Hummingbird-based phones.
You can see how snappy the browser is (including page load, pan and zoom speed, and Flash performance) at 12:40 in our LG Optimus 2X Overview video:
Moving along is the SunSpider Javascript benchmark, which is a regular fixture in our smartphone reviews. The benchmark measures the performance of various Javascript code snippets designed to represent real world js usage. When run on a smartphone it gives us the idea of how fast the browser, OS and hardware platform (including SoC) is at running these Javascript tests. Good js performance alone isn't enough to provide a fast web browsing experience, but it's one component.
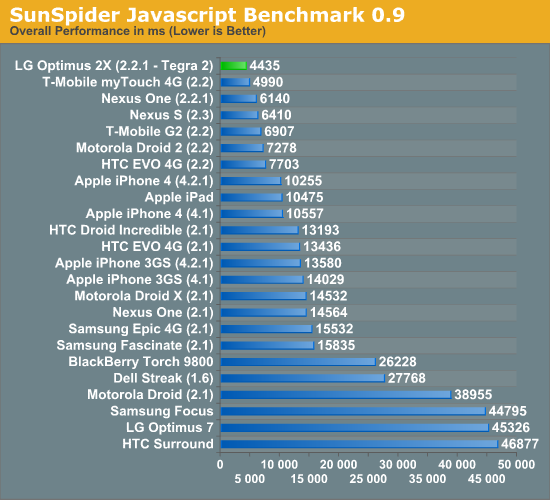
Google has been on a Javascript performance optimization rampage since Android's initial release. You get a hint of that here when you look at the clustering of Android scores. The move from Android 1.6 to 2.1 was responsible for a big jump in performance, and we saw another major improvement with the move to Froyo (2.2).
The SunSpider benchmark isn't explicitly multithreaded, although some of the tests within the benchmark will take advantage of more than one core. As a result, some of the performance gain here over a Cortex A8 is due to the out-of-order execution engine and shorter pipeline of the Cortex A9 and not just the two cores.
The Motorola Droid 2 uses a TI OMAP 3620 with a single 1GHz Cortex A8 core. As such it is the best hardware comparison to the LG Optimus 2X with its dual Cortex A9 cores. The performance improvement here is very good. NVIDIA's Tegra 2 manages a 64% faster score under SunSpider than the OMAP 3620 based Droid 2. The advantage over Samsung's Hummingbird SoC is narrower but still an impressive 44%.
The comparison to T-Mobile's myTouch 4G is very telling. The myTouch 4G uses the latest 45nm SoC from Qualcomm. Architecturally this SoC still has the same Scorpion CPU core as previous Snapdragons, but the difference here is the memory interface. The 45nm Snapdragons feature a LP-DDR2 memory interface vs. the LP-DDR1 interface from the 65nm versions. The faster memory interface is likely responsible for the improved performance here.
With a faster memory bus, Qualcomm's 45nm Snapdragon closes the gap between it and the Optimus 2X's Tegra 2. NVIDIA only holds a 12.5% performance advantage here vs. Qualcomm's single core 45nm Snapdragon. A 1.2GHz dual-core Snapdragon (the 8660) would likely outperform NVIDIA's Tegra 2 in this test.
In terms of currently available hardware however, the LG Optimus 2X is clearly the fastest device we have running SunSpider. And NVIDIA's Tegra 2 is the fastest SoC in our SunSpider benchmarks.
Rightware's BrowserMark is another JavaScript performance benchmark. Rightware modeled its benchmark after the JavaScript frameworks and functions used by websites like Facebook, Amazon and Gmail among others. The results are simply one aspect of web browsing performance, but an important one:
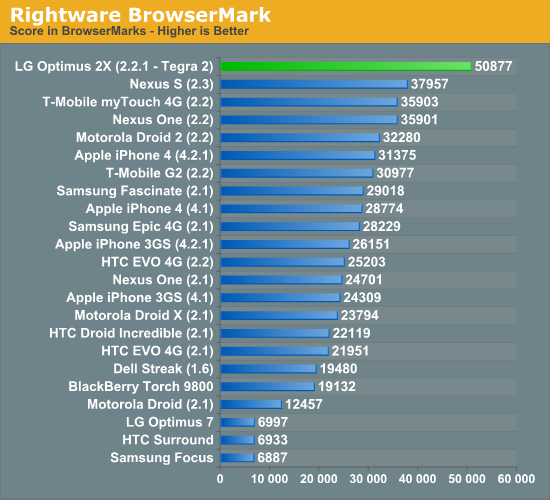
BrowserMark shows the Optimus 2X with a 57% performance advantage over the Motorola Droid 2. The performance advantage is similar to what we saw in our SunSpider results. The gap doesn't close by much as we look at Samsung Hummingbird and Qualcomm Snapdragon based SoCs. NVIDIA and LG maintain a 41.5% performance advantage over the 45nm Snapdragon based myTouch 4G.
It's still difficult to draw real conclusions about why some SoCs perform better than others, however in this case I'd guess that it's probably equal parts A9 and dual-core giving the Tegra 2 its performance advantage in BrowserMark.
The combination of these two js benchmarks proves one point: the LG Optimus 2X and NVIDIA's Tegra 2 provide the fastest Android web browsing experience we've seen thus far. A message that is continuously echoed in our day to day use of the phone. The Optimus 2X is the first Android phone to render web pages as quickly, if not quicker, than the iPhone 4.
WiFi performance is often surprisingly bad on smartphones we test for some reason. Thankfully, the LG Optimus 2X did very well in our tests:
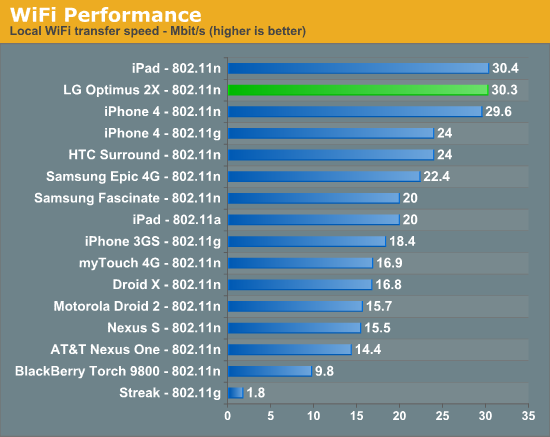
At 30.3Mbps, the Optimus 2X all but tied the iPad for local network WiFi performance. It's not only the fastest Android phone we've run through our WiFi test, but also the fastest WiFi we've tested on a smartphone in general. Congrats to LG.
One of the original Android 3D benchmarks, Neocore has lost much of its usefulness over the past year. With the move to PowerVR SGX 535/540 and Adreno 205 GPUs in newer SoCs we run into a curious problem—nearly all of the high end GPUs converge at around 60 fps:
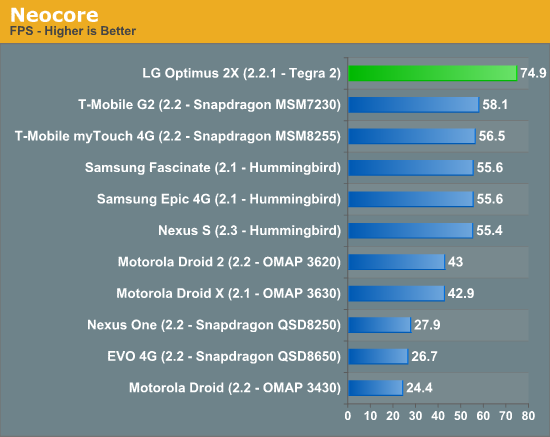
This isn't some mystic performance convergence, rather it's the OS-wide frame rate cap both Qualcomm and Imagination Technologies implement on their drivers. Neocore can't physically run any faster because the graphics driver won't allow it. The idea behind the cap is simple. Running at higher frame rates would simply run the GPU faster, which would require data from the CPU more quickly and in turn fire the memory interface more often and just draw a lot more power. Limting frame rate to 60 fps keeps performance nice and smooth but conserves battery life at the same time.
With a 60 fps limit, we can't use Neocore to tell the difference between GPUs and SoCs capable of running the benchmark at higher frame rates—everything looks the same. So why does the LG Optimus 2X score 74.9 fps? NVIDIA is no stranger to benchmarking—it simply raised the frame rate limit to 117.5 fps across the OS, and as a result we get a meaningful score in Neocore from at least one high end GPU.
Unfortunately this tells us nothing about how Tegra 2 stacks up against the PowerVR SGX 535/540 or Qualcomm's Adreno 205. The only things we can conclude are: 1) NVIDIA is going to eat the competition for breakfast once more smartphone benchmarks are available and we start playing optimization games, and 2) Neocore is a meaningless benchmark and should be retired.
This next benchmark needs no introduction. Quake 3 graced the pages of AnandTech years ago, serving as a great GPU and eventually an even better CPU benchmark as our systems grew to be more powerful. While hardly representative of the type of 3D games that are being ported to smartphones today, Quake 3 remains an interesting measure of GPU and SoC performance.
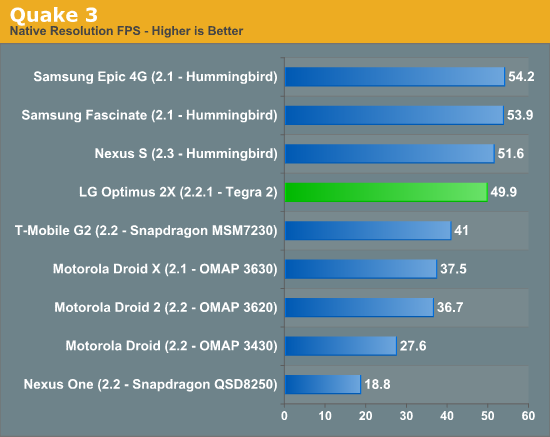
NVIDIA's Tegra 2 is clearly faster than Qualcomm's MSM7230, however it plays second fiddle to the PowerVR SGX 540 in Samsung's Hummingbird. The why is difficult to explain. Quake 3 is a fairly simple game by today's standards. There are several layers of texturing but no pixel or vertex shaders and very little geometry. Running on modern hardware, Quake 3 is a GPU texturing/ROP test and a triangle setup test. Performance here should be influenced by the memory interface, cache performance, CPU-GPU interface as well as the GPU's ability to churn out textured pixels. I suspect that NVIDIA's driver and GPU itself just aren't optimized for this type of a game. The performance is decent, but it's no faster than a PowerVR SGX 540.
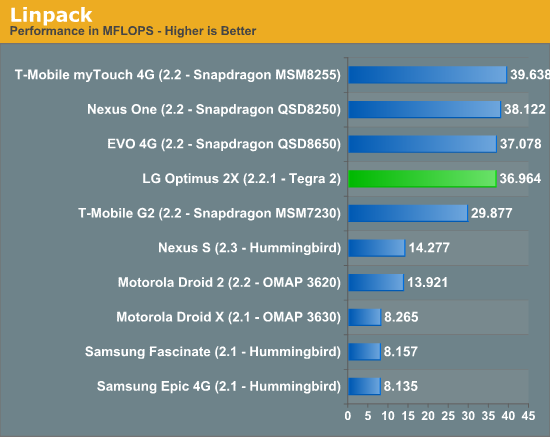
The Cortex A8's FPU wasn't pipelined and thus presented serious performance limitations when used. The Cortex A9 corrects this and thus we see a huge performance increase in Linpack. Qualcomm however appears to have always had a pretty decent FP setup in its Scorpion core, resulting in comparable performance to what NVIDIA delivered with Tegra 2.
It's unclear to us how much of the Linpack Android port uses VFP code vs. NEON code. Based on the results here it would appear to be a VFP benchmark, not touching NEON at all. In addition, the Linpack test we use from the Android market appears to be single-threaded.
Quadrant
Quadrant is one of the unfortunate realities of Android smartphone benchmarking today: we have a lot of synthetic benchmarks that give us relatively little insight into real world app performance. While I expect the smartphone benchmarking tools to improve over the coming 24 months, we'll have to make do for now.
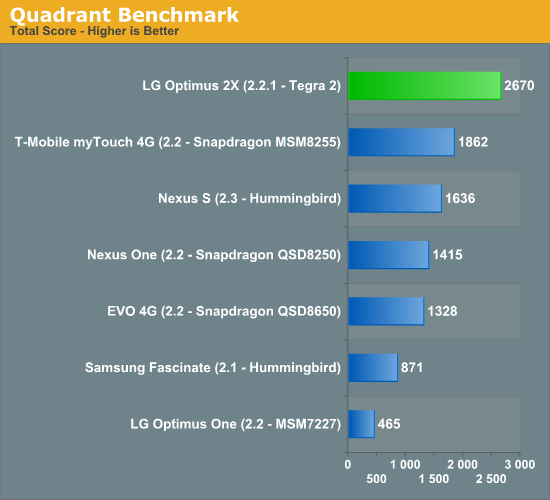
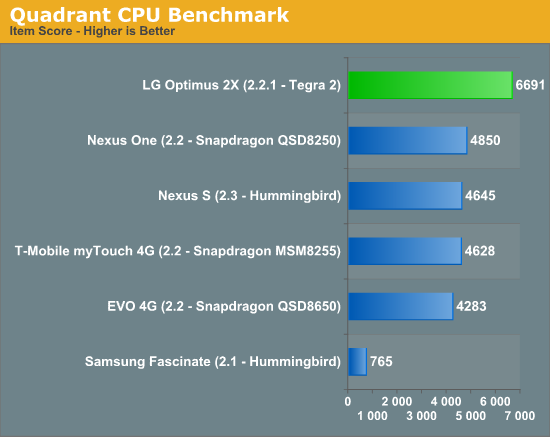
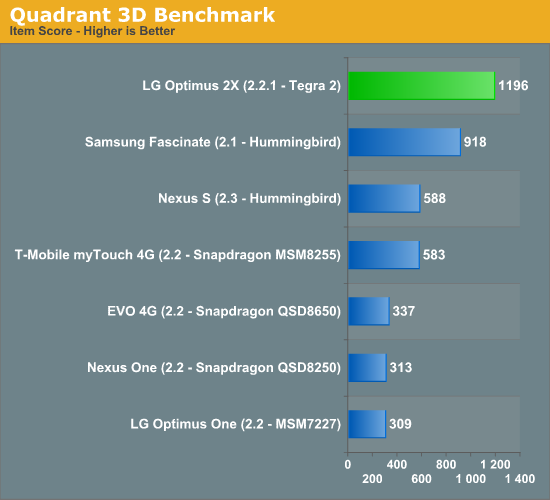
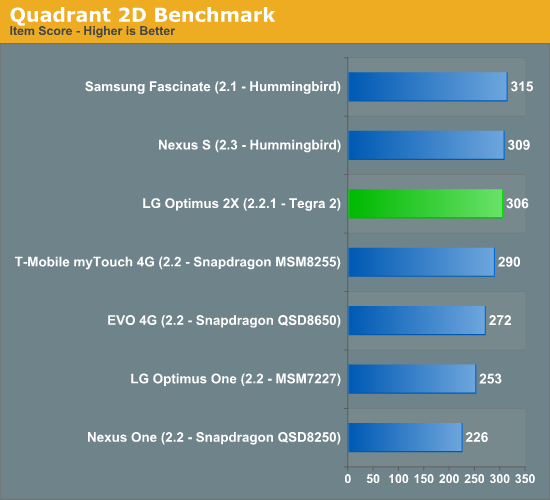
Quadrant provides an overall score as well as individual category scores. As you'd expect, NVIDIA's Tegra 2 is on top. CPU performance, as measured in Quadrant, is 38% faster than the fastest SoCs on the market today. Given that this is a purely synthetic test I'd expect to see smaller gains in real world apps. Quadrant's CPU benchmark, like linpack, also is just a single thread:
What is surprising is just how well the Tegra 2 does in Quadrant's memory and I/O benchmarks:
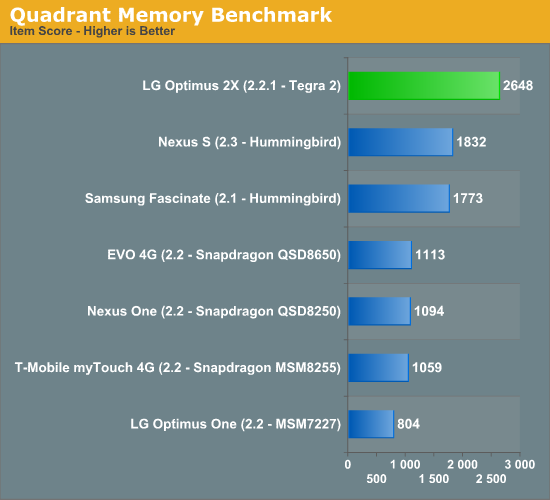
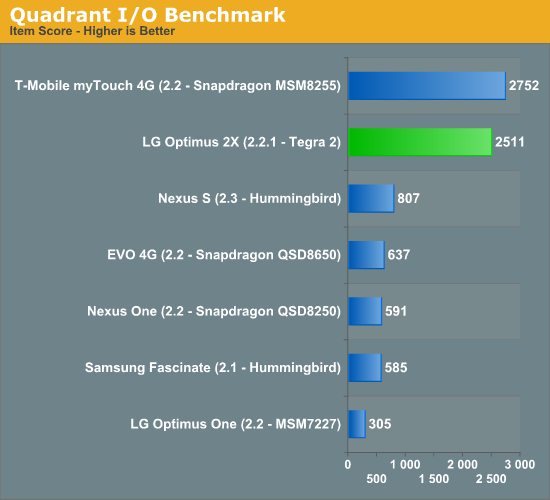
The Quadrant developers aren't very open about what these tests do other than obviously stress the memory interface and stream data over the I/O bus. NVIDIA has claimed that it has the best memory controller and arbitration logic of any of the SoC players. These advantages could be the cause of NVIDIA's solid showing in Quadrant's memory and I/O tests.
GLBenchmark 2.0
GLBenchmark 2.0—as its name implies—tests OpenGL ES 2.0 performance on compatible devices. The suite includes two long benchmarking scenarios with a demanding combination of OpenGL ES 2.0 effects, and individual tests such as swap buffer speed (for determining the framerate cap), texture fill, triangle, and geometric tests. GLBenchmark 2.0 also leverages texture based and direct lighting, bump, environment, and radiance mapping, soft shadows, vertex shader based skinning, level of detail support, multi-pass deferred rendering, noise textures, and ETC1 texture compression.
GLBenchmark 2.0 is the best example of an even remotely current 3D game running on Android—and even then this is a stretch. If you want an idea of how the Tegra 2 GPU stacks up to the competition however, GLBenchmark 2.0 is probably going to be our best bet (at least until we get Epic to finally release an Unreal Engine benchmark for Android).

The first benchmark, Egypt, tests OpenGL ES 2.0 and represents the newest and most demanding benchmark. The second— GLBenchmark PRO—also tests OpenGL ES 2.0 features, and is a port of an earlier GLBenchmark 1.1 test which focused on OpenGL ES 1.1 performance).
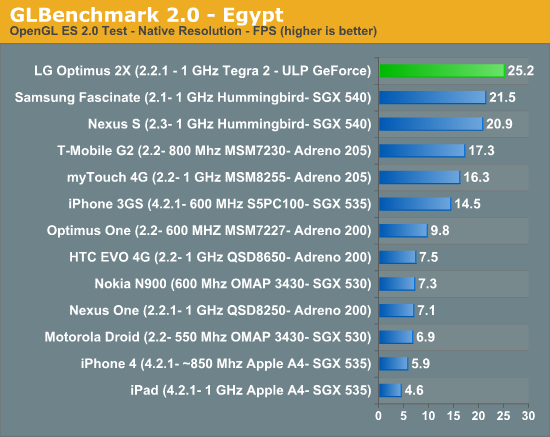
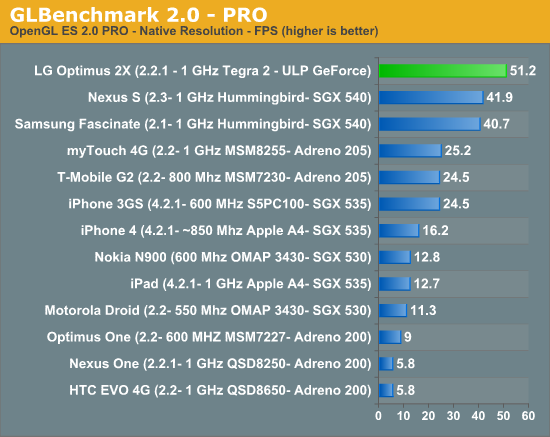
In both OpenGL ES 2.0 benchmarks NVIDIA's Tegra 2 comes out ahead of PowerVR's SGX 540. Granted it's impossible to know how much of this is driver optimization for the benchmark vs. pure hardware capability, but I'd expect that these results are reasonably believable. NVIDIA's Tegra 2 looks to be 15—25% faster than the PowerVR SGX 540 based Samsung Hummingbird SoC. Not all of this is going to be due to the GPU as even the most taxing games run on smartphones are still quite CPU bound at times.
BaseMark GUI Benchmark
Basemark divides benchmarking into two categories—feature tests and the final overall user interface test. We couldn't get the UI test to run reliably on the Optimus 2X so we'll be looking at the feature tests exclusively. These are named animation, vertex streaming, texture streaming, and alpha blending as shown in the menu above. Each tests a different collection of what Rightware believes are representative graphics tasks that will be leveraged in user interfaces moving forward.
First up among those feature tests is animation, which animates a graphics element (in this case, a robot moving through a set of actions) by stepping through a table of keyframes and interpolating the character's movement between using splines. This particular benchmark uses ES 2.0 APIs and per vertex lighting, but the purpose of this test is to be as CPU-bound as possible and specifically stress floating point performance.

Animation Test
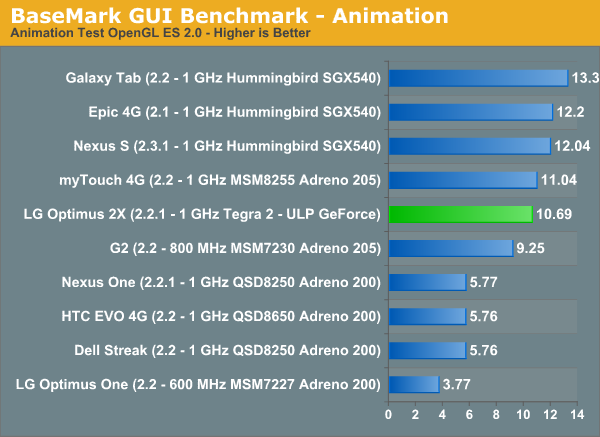
NVIDIA's Tegra 2 has no SIMD FP engine (NEON) and instead relies on ARM's first fully pipelined FPU. The result is competitive performance to the NEON equipped Hummingbird and Snapdragon SoCs, but not better performance. NVIDIA told us that to implement NEON would be to incur a 30% die penalty for a performance advantage that would only impact a small portion of your code. It remains to be seen how much the NEON tradeoff will actually cost NVIDIA this generation. If BaseMark's Animation benchmark is any indication, the penalty may not be all that bad.
Next are the vertex and texture streaming tests, both of which measure asset streaming performance—according to RightWare, effectively memory bandwidth. The vertex test loads geometry data into GPU memory and frees it when no longer needed. The scene itself involves a lot of geometry—ten repeating city blocks which the camera moves through with increasing speed and draw distance. The test ramps from around 3k vertices to 15k vertices per frame, and 190k to 250k triangles per frame. There's a single texture material, fog, two lights, and OpenGL ES 2.0 shaders which use per vertex lighting.

Vertex Test
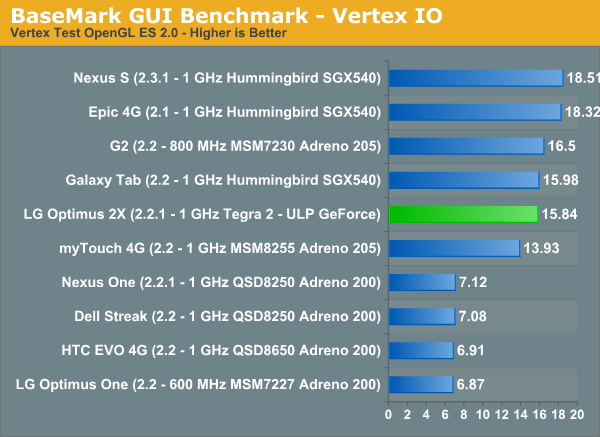
The Vertex IO test is an important test of performance as it measures the CPU-GPU interface bandwidth, vertex shader performance and memory bandwidth. NVIDIA does well here but and remains competitive with Samsung & Qualcomm, although definitely not faster.
The texture test is a bit more straightforward, quickly loading images from RAM into the GPU memory and discarding them.

Texture Test
These asset streaming tests effectively test memory bandwidth from disk into RAM and into to GPU memory. Although Kanzi supports ETC texture compression (and Basemark exposes this option for testing), we've initially tested with the default configuration which has ETC texture compression disabled.
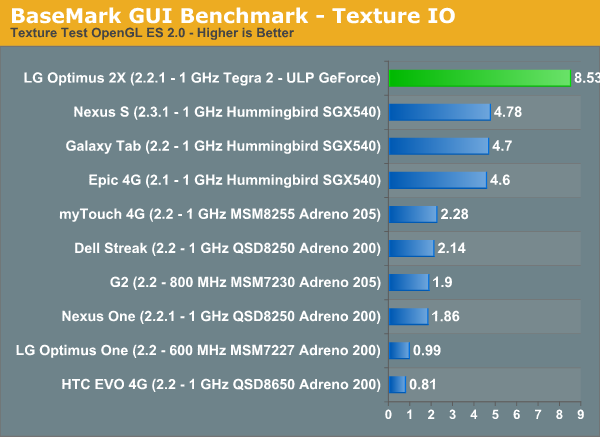
Quadrant implied that NVIDIA's paths to NAND and main memory were both ridiculously quick. BaseMark's Texture IO test corroborates the implication. The Optimus 2X manages a score here that's nearly twice that of the closest competitor. A fast memory and I/O interface never hurts. I am curious to know how much of the performance here is due to NVIDIA's new ROPs that reuse pixel shader hardware.
Blend testing—as its name implies—tests alpha blended rendering by drawing a number of semi-transparent contact cards atop each other. These are overlaid sequentially until we reach a desired number of layers. This test actually runs twice, first with front to back ordering of these contact cards, and then with back to front ordering.
This ordering difference shouldn't be confused with the fact that feature test actually runs in both back to front and front to back rendering orders and are combined later.
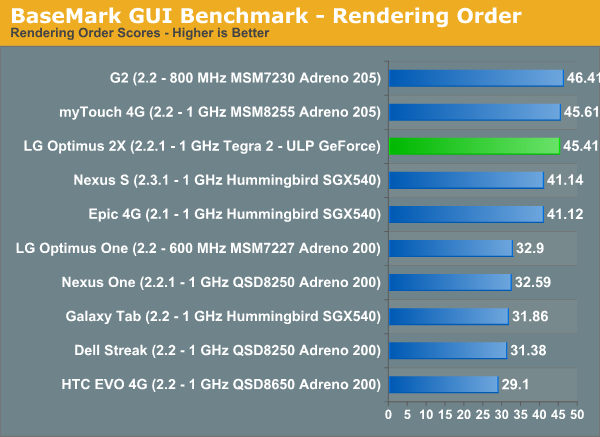

Blend Test
Next is the composition test, which composites interface screens rendered off-scene into one large tiled user interface. The example here are applications rendering in the background being composited into one view. This test combines 16 off-scene objects.

Composition Test
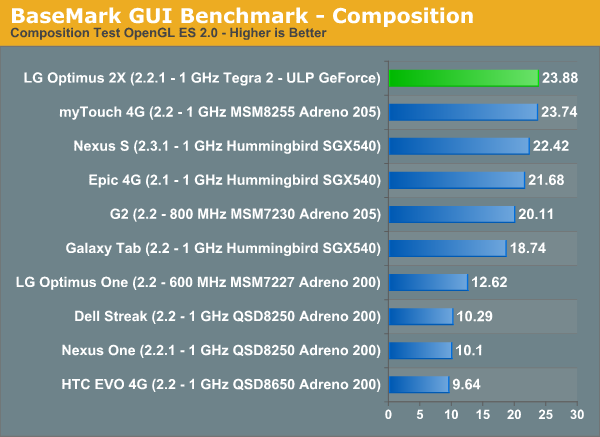
The composition test puts NVIDIA's Tegra 2 and the Optimus 2X at the top of the chart. As a result, Android UI performance feels very snappy running on Tegra 2. All we need now is Gingerbread.


75 Comments
View All Comments
GoodRevrnd - Tuesday, February 8, 2011 - link
TV link would be awesome, but why would you need the phone to bridge the TV and network??aegisofrime - Monday, February 7, 2011 - link
May I suggest x264 encoding as a test of the CPU power? There's a version of x264 available for ARM chips, along with NEON optimizations. Should be interesting!Shadowmaster625 - Monday, February 7, 2011 - link
What is the point in having a high performance video processor when you cannot do the two things that actually make use of it? Those two things are: 1. Watch any movie in your collection without transcoding? (FAIL) 2. Play games. No actual buttons = FAIL. If you think otherwise then you dont actually play games. Just stick with facebook flash trash.TareX - Wednesday, February 9, 2011 - link
The only reason I'd pay for a dual core phone is smooth flash-enabled web browsing, not gaming.zorxd - Monday, February 7, 2011 - link
Stock Android has it too. There is also E for EDGE and G for GPRS.Exophase - Monday, February 7, 2011 - link
Hey Anand/Brian,There are some issues I've found with some information in this article:
1) You mention that Cortex-A8 is available in a multicore configuration. I'm pretty sure there's no such thing; you might be thinking of ARM11MPCore.
2) The floating point latencies table is just way off for NEON. You can find latencies here:
http://infocenter.arm.com/help/index.jsp?topic=/co...
It's the same in Cortex-A9. The table is a little hard to read; you have to look at the result and writeback stages to determine the latency (it's easier to read the A9 version). Here's the breakdown:
FADD/FSUB/FMUL: 5 cycles
FMAC: 9 cycles (note that this is because the result of the FMUL pipeline is then threaded through the FADD pipeline)
The table also implies Cortex-A9 adds divide and sqrt instructions to NEON. In actuality, both support reciprocal approximation instructions in SIMD and full versions in scalar. The approximation instructions have both initial approximation with ~9 bits of precision and Newton Rhapson step instructions. The step instructions function like FMACs and have similar latencies. This kind of begs the question of where the A9 NEON DIV and SQRT numbers came from.
The other issue I have with these numbers is that it only mentions latency and not throughput. The main issue is that the non-pipelined Cortex-A8 FPU has throughput almost as bad as its latency, while all of the other implementations have single cycle throughput for 2x 64-bit operations. Maybe throughput is what you mean by "minimum latency", however this would imply that Cortex-A9 VFP can't issue every cycle, which isn't the case.
3) It's obvious from the GLBenchmark 2.0 Pro screenshot that there are some serious color limitations from Tegra 2 (look at the woman's face). This is probably due to using 16-bit. IMG has a major advantage in this area since it renders at full 32-bit (or better) precision internally and can dither the result to 16-bit to the framebuffer, which looks surprisingly similar in quality to non-dithered 32-bit. This makes a 16-bit vs 16-bit framebuffer comparison between the two very unbalanced - it's far more fair to just do both at 32-bit, but it doesn't look like the benchmark has any option for it. Furthermore, Tegra 2 is limited to 16-bit (optionally non-linear) depth buffers, while IMG utilizes 32-bit floating point depth internally. This is always going to be a disadvantage for Tegra 2 and is definitely worth mentioning in any comparison.
Finally I feel like ranting a little bit about your use of the Android Linpack test. Anyone with a little common sense can tell that a native implementation of Linpack on these devices will yield several dozen times more than 40MFLOPS (should be closer to 1-4 FLOP/CPU cycle). What you see here is a blatant example of Dalvik's extreme inability to perform with floating point code that extends well beyond an inability to perform SIMD vectorization.
metafor - Monday, February 7, 2011 - link
According to the developer of Linpack on Android:http://www.greenecomputing.com/category/android/
It is mostly FP64 calculations done on Dalvik. While this may not be the fastest way to go about doing linear algebra, it is a fairly good representation of relative FP64 performance (which only exist in VFP).
And let's face it, few app developers are going to dig into Android's NDK and write NEON optimized code.
Exophase - Monday, February 7, 2011 - link
Then let's ask this instead: who really cares about FP64 performance on a smartphone? I'd also argue that it is not even a good representation of relative FP64 performance since that's being obscured so much by the quality of the JITed code. Hence why you see Scorpion and A9 perform a little over twice as fast as A8 (per-clock) instead of several times faster. VFP is still in-order on Cortex-A9, competent scheduling matters.Maybe a lot of developers won't write NEON code on Android, but where it's written it could very well matter. For one thing, in Android itself. And theoretically one day Dalvik could actually be generating NEON competently.. so some synthetic tests of NEON could be a good look at what could be.
metafor - Monday, February 7, 2011 - link
Well, few people really :)Linpack as it currently exists on Android probably doesn't tell very much at all. But if you're just going to slap together an FP heavy app (pocket scientific computing anyone?) and aren't a professional programmer, this likely represents the result you see.
I wouldn't mind seeing SpecFP ported natively to Android and running NEON. But alas, we'd need someone to roll up their sleeves and do that.
I did do a native compile of Linpack using gcc to test on my Evo, though. It's still not SIMD code, of course, but native results using VFP were around the 70-80MFLOPS mark. Of course, it's scheduling for the A8's FPU and not Scorpion's.
Anand Lal Shimpi - Monday, February 7, 2011 - link
Thanks for your comment :)1) You're very right, I was thinking about the ARM11 - fixed :)
2) Make that 2 for 2. You're right on the NEON values, I mistakenly grabbed the values from the cycles column and not the result column. The DIV/SQRT columns were also incorrect, I removed them from the article.
I mentioned the lack of pipelining in the A8 FPU earlier in the article but I reiterated it underneath the table to hammer the point home. I agree that the lack of pipelining is the major reason for the A8's poor FP performance.
3) Those screenshots were actually taken on IMG hardware. IMG has some pretty serious rendering issues running GLBenchmark 2.0.
4) I'm not happy with the current state of Android benchmarks - Linpack included. Right now we're simply including everything we can get our hands on, but over the next 24 months I think you'll see us narrow the list and introduce more benchmarks that are representative of real world performance as well as contribute to meaningful architecture analysis.
Take care,
Anand