AMD's Fall Refresh: New Phenom II and Athlon II CPUs Balance Price and Performance
by Anand Lal Shimpi on September 21, 2010 2:52 AM EST- Posted in
- CPUs
- AMD
- Phenom II X6
- Athlon II
3dsmax 9 - SPECapc 3dsmax CPU Rendering Test
Today's desktop processors are more than fast enough to do professional level 3D rendering at home. To look at performance under 3dsmax we ran the SPECapc 3dsmax 8 benchmark (only the CPU rendering tests) under 3dsmax 9 SP1. The results reported are the rendering composite scores.
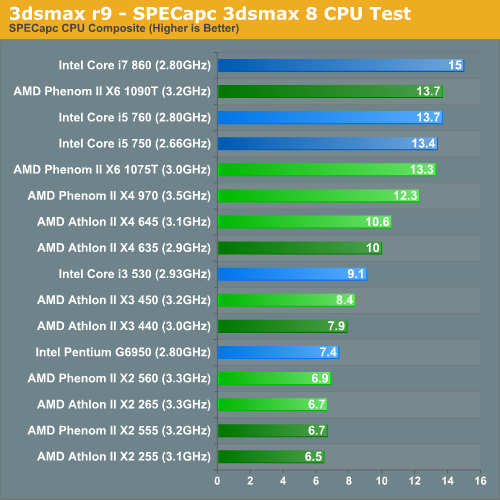
The 1075T comes close to its competitors in the 3dsmax test, while the Phenom II X4 970 definitely falls short.
The quad-core Athlon II X4 645 does much better than the dual-core i3 530 (and by extension the 540). The same holds true for the Athlon II X3 450 vs. the Pentium G6950.
Cinebench R10
Created by the Cinema 4D folks we have Cinebench, a popular 3D rendering benchmark that gives us both single and multi-threaded 3D rendering results.
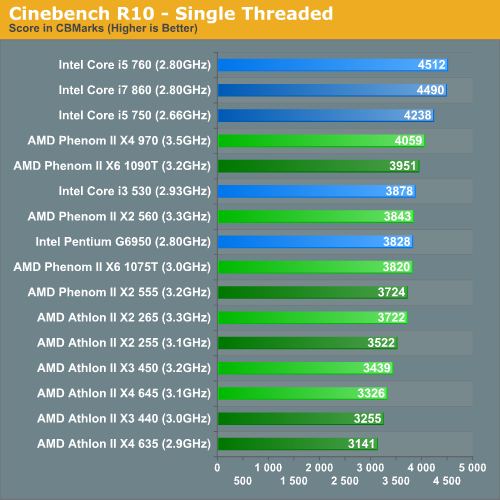
Single threaded performance is AMD's weakest point. Even at 3.5GHz the Phenom II X4 970 can't keep up with a turboed Core i5 750. If you run a predominantly single threaded workload, Intel will typically offer you better performance than AMD.
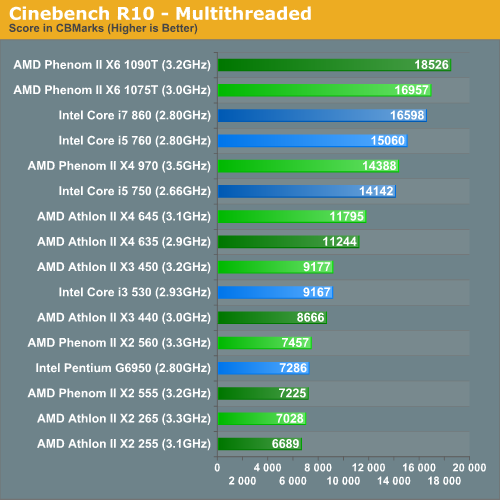
Turn up the thread count however and the value proposition shifts to AMD. The Phenom II X6 1075T gives you more for your money in a heavily threaded app than the Core i7 860, and the Phenom II X4 970 is a smidge ahead of the i5 750. The Athlon II X4 645 and Athlon II X3 450 both do very well.
I've started running Cinebench 11.5 in preparation for an update to Bench, some of the initial results are below:
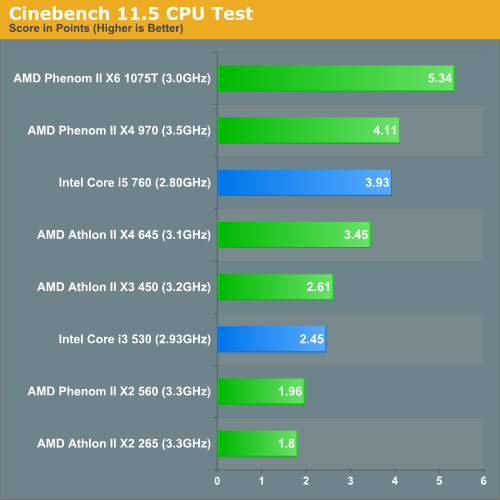
The default benchmark is heavily threaded. As a result the scores echo what we just saw.


98 Comments
View All Comments
Guspaz - Tuesday, September 21, 2010 - link
A few price to performance graphs would be nice. You know, "sysmarks per dollar", or that sort of thing. It would help identify the sweet spot in processor reviews.Anand Lal Shimpi - Tuesday, September 21, 2010 - link
I've been thinking about doing it for a while, it looks like there's overwhelming desire for it so I'll begin working on the best way to put it together :)Take care,
Anand
Taft12 - Tuesday, September 21, 2010 - link
I'm not sure "Sysmarks/$" is all that more useful than a general recommendation that the results reveal quite clearly. In this article for example, the Athlon X3 is a stellar value while the Athlon X4 and i5 quad cores are also very good.However, this has been common knowledge for over a year now, so are we really getting anything we didn't already know from a "Sysmarks/$"-type of graph?
RyuDeshi - Monday, September 27, 2010 - link
I haven't been in the market for a new processor/chipset for over a year now, so price/performance is something that would be very helpful for me right now with all these newer chips since Core2 and Phenom I. So I concur with the OP, I would love to see some price references in or near some graphs.marraco - Tuesday, September 21, 2010 - link
No, please. Do not do bar charts. Do X-Y price-performance charts. They are far more useful.vol7ron - Tuesday, September 21, 2010 - link
I'm kind of partial to the smallnetbuilder's price-performance chart: http://www.smallnetbuilder.com/index.php?option=co...You can hover to see the item.
evilspoons - Tuesday, September 21, 2010 - link
Seconded. X-Y performance charts are the way to go!!evilspoons - Tuesday, September 21, 2010 - link
Err, price-performance.Brucmack - Wednesday, September 22, 2010 - link
If you do that, please integrate the differences in power consumption somehow. It would be silly to save $20 by buying an AMD processor if it costs $50 more to run over its lifetime.strikeback03 - Wednesday, September 22, 2010 - link
How long would that lifetime be? 1 year? 4 years? Is the machine on all the time but idling 22 hrs a day? Is it gamed on 10 hrs a day but off the rest?