AMD's Fall Refresh: New Phenom II and Athlon II CPUs Balance Price and Performance
by Anand Lal Shimpi on September 21, 2010 2:52 AM EST- Posted in
- CPUs
- AMD
- Phenom II X6
- Athlon II
SYSMark 2007 Performance
Our journey starts with SYSMark 2007, the only all-encompassing performance suite in our review today. The idea here is simple: one benchmark to indicate the overall performance of your machine.
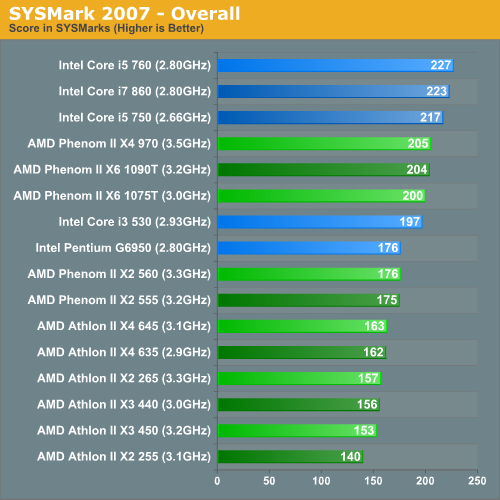
Let's go down the matchups shall we? The Phenom II X4 970 BE is competitive with the Core i5 750. Intel manages a 5.9% performance advantage in this comparison, but as I mentioned earlier the two chips will trade blows across much of our benchmark suite.
The Phenom II X6 1075T doesn't have a direct competitor but here it does worse than the cheaper Core i5 750. SYSMark is mostly a test of good dual-core performance and as a result Intel's turbo does more for performance here than AMD's 2-extra cores. It's a valid scenario to keep in mind as the number of applications that can stress all 6 cores are limited. Although when you're running one, there's generally no substitute for more cores.
As I mentioned in the introduction, the Phenom II X2 560 will easily lose to the Core i3 530 as the graph shows above. The same is true for the Athlon II X4 645. The chip gives you four cores at a very competitive price, but in a test that primarily stresses two cores the 645 doesn't get a chance to run.
The Athlon II X3 450 vs. Pentium G6950 matchup begins in Intel's favor, however this is the one and only time in our review that you'll see this happen.
Adobe Photoshop CS4 Performance
To measure performance under Photoshop CS4 we turn to the Retouch Artists’ Speed Test. The test does basic photo editing; there are a couple of color space conversions, many layer creations, color curve adjustment, image and canvas size adjustment, unsharp mask, and finally a gaussian blur performed on the entire image.
The whole process is timed and thanks to the use of Intel's X25-M SSD as our test bed hard drive, performance is far more predictable than back when we used to test on mechanical disks.
Time is reported in seconds and the lower numbers mean better performance. The test is multithreaded and can hit all four cores in a quad-core machine.
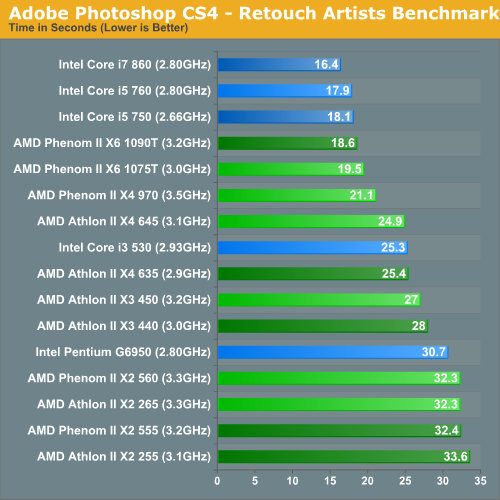
Our Photoshop benchmark has traditionally favored Intel's architectures, which is definitely visible when you look at the Phenom II X6 1075T and Phenom II X4 970 BE above. The Athlon II X4 645 does slightly better than the Core i3 530 (effectively on-par with the 540), while the Athlon II X3 450 does noticeably better than the Pentium G6950. You can also see why I'm not really interested in the dual-core parts. They perform well, but that third core does come in handy for very little added cost.


98 Comments
View All Comments
Guspaz - Tuesday, September 21, 2010 - link
A few price to performance graphs would be nice. You know, "sysmarks per dollar", or that sort of thing. It would help identify the sweet spot in processor reviews.Anand Lal Shimpi - Tuesday, September 21, 2010 - link
I've been thinking about doing it for a while, it looks like there's overwhelming desire for it so I'll begin working on the best way to put it together :)Take care,
Anand
Taft12 - Tuesday, September 21, 2010 - link
I'm not sure "Sysmarks/$" is all that more useful than a general recommendation that the results reveal quite clearly. In this article for example, the Athlon X3 is a stellar value while the Athlon X4 and i5 quad cores are also very good.However, this has been common knowledge for over a year now, so are we really getting anything we didn't already know from a "Sysmarks/$"-type of graph?
RyuDeshi - Monday, September 27, 2010 - link
I haven't been in the market for a new processor/chipset for over a year now, so price/performance is something that would be very helpful for me right now with all these newer chips since Core2 and Phenom I. So I concur with the OP, I would love to see some price references in or near some graphs.marraco - Tuesday, September 21, 2010 - link
No, please. Do not do bar charts. Do X-Y price-performance charts. They are far more useful.vol7ron - Tuesday, September 21, 2010 - link
I'm kind of partial to the smallnetbuilder's price-performance chart: http://www.smallnetbuilder.com/index.php?option=co...You can hover to see the item.
evilspoons - Tuesday, September 21, 2010 - link
Seconded. X-Y performance charts are the way to go!!evilspoons - Tuesday, September 21, 2010 - link
Err, price-performance.Brucmack - Wednesday, September 22, 2010 - link
If you do that, please integrate the differences in power consumption somehow. It would be silly to save $20 by buying an AMD processor if it costs $50 more to run over its lifetime.strikeback03 - Wednesday, September 22, 2010 - link
How long would that lifetime be? 1 year? 4 years? Is the machine on all the time but idling 22 hrs a day? Is it gamed on 10 hrs a day but off the rest?