Server Clash: DELL's Quad Opteron DELL R815 vs HP's DL380 G7 and SGI's Altix UV10
by Johan De Gelas on September 9, 2010 7:30 AM EST- Posted in
- IT Computing
- AMD
- Intel
- Xeon
- Opteron
Real World Power
In the real world you do not run your virtualized servers at their maximum just to measure the potential performance. Neither do they run idle. The user base will create a certain workload and expect this workload to be performed with the lowest response times. The service provider (that is you!) wants the server to finish the job with the least amount of energy consumed. So the general idea behind this new benchmark scenario is that each server runs exactly the same workload and that we then measure the amount of energy consumed. It is similar to our previous article about server power consumption, but the methodology has been enhanced.
We made a new benchmark scenario. In this scenario, we changed three things compared to the vApus Mark II scenario:
- The number of users or concurrency per VM was lowered significantly to throttle the load
- The OLTP VMs are omitted
- We ran with two tiles
vApus Mark II loads the server with up to 800 users per second on the OLAP test, up to 50 users per second on the website, and the OLTP test is performing transactions as fast as it can. The idea is to give the server so much work that it is constantly running at 95-99% CPU load, allowing us to measure throughput performance quite well. vApus Mark II is designed as a CPU/memory benchmark.
To create a real world “equal load” scenario, we throttle the number of users to a point where you typically get somewhere between 30% and 60% CPU load on modern servers. As we cannot throttle our OLTP VM (Swingbench) as far we as know, we discarded the OLTP VM in this test. If we let the OLTP test run at maximum speed, the OLTP VM would completely dominate the measurements.
We run two tiles with 14 vCPUs (eight vCPUs for OLAP, three webservers with two vCPUs per tile), so in total 28 virtual CPUs are active. There are some minor tasks in the background: a very lightly loaded Oracle databases that feeds the three websites (one per tile), the VMware console (which idles most of the time), and of course the ESX hypervisor kernel. So all in all, you have a load on about 30-31 vCPUs. That means that some of the cores of the server system will be idleing, just like in the real world. On the HP DL380 G7, this “equal workload” benchmark gives the following CPU load graph:
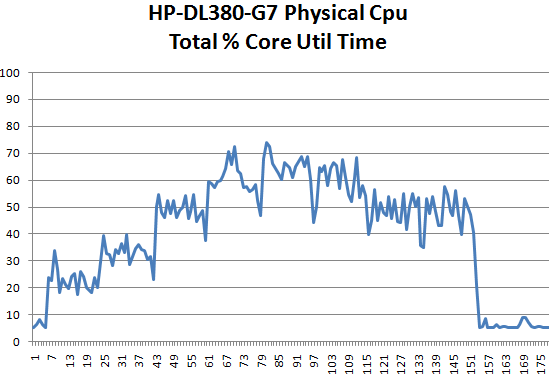
On the Y-axis is CPU load, and on the X-axis is the periodic CPU usage. ESXtop was set up to measure CPU load every five seconds. Each test was performed three times: two times to measure performance and energy consumption, and the third time we did the same thing but with extensive ESXtop monitoring. To avoid having the CPU load in the third run much higher than the first two, we measured every five seconds. We measure the energy consumption over 15 minutes.
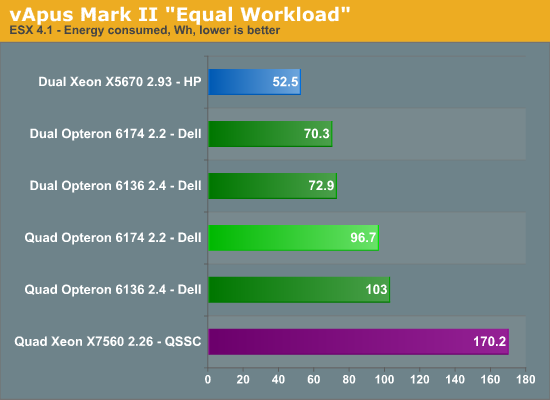
Again, the dual Opteron numbers are somewhat high as we are running them in a quad socket machine. A Dell R715 is probably going to consume about 5% less. If we get the chance, we'll verify this. But even if the dual Opterons are not ideal measurements in comparison to the dual Xeon, they do give us interesting info.
Two Opterons CPUs are consuming 26.5 Wh (96.7 - 70.2). So if we extrapolate, this means roughly 55% (53 Wh out of 97Wh) of the total energy in our quad Opteron server is consumed by the four processors. Notice also that despite the small power handicap of the Opteron (a dual socket server will consume less), it was able to stay close to the Xeon X5670 based server when comparing maximum power (360W vs 330W). But once we introduce a 30-50% load, the gap between the dual Opteron setup and dual Xeon setup widens. In other words, the Opteron and Xeon are comparable at high loads, but the Xeon is able to save more power at lower loads. So there is still quite a bit of room for improvement: power gating will help the “Bulldozer” Opteron drive power consumption down at lower load.
Ok, enough interesting tidbits, who has the best performance per watt ratio?


51 Comments
View All Comments
Chrisrodinis - Thursday, February 27, 2014 - link
This article is about Dell servers in 2010. For comparison purposes here is an overview of a Dell PowerEdge M420 Blade server. This video has cool effects with upbeat production values. Please check it out, thanks: https://www.youtube.com/watch?v=iKIG430z0PI