Western Digital's New VelociRaptor VR200M: 10K RPM at 450GB and 600GB
by Anand Lal Shimpi on April 6, 2010 8:00 AM EST- Posted in
- Storage
Power Consumption
Western Digital promised that the new VelociRaptor would use no more power than its predecessor. To find out we measured the current going to the drive across all voltage rails and determined total power consumption at the drive level in both idle and while performing our 2MB sequential write test:
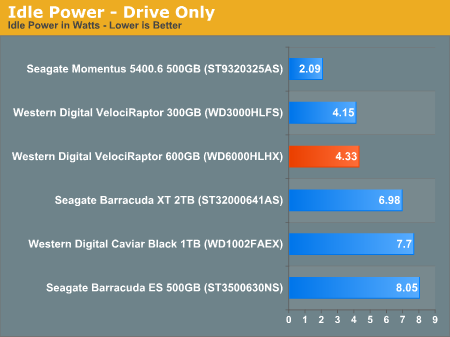
Power consumption did go up by 4.3% at idle, but hardly anything to complain about. More performance at roughly the same power isn't a bad thing. Do pay attention to how much more power the larger 3.5" drives consume. This isn't really an issue on the desktop, but in a server with tons of spindles it quickly adds up.
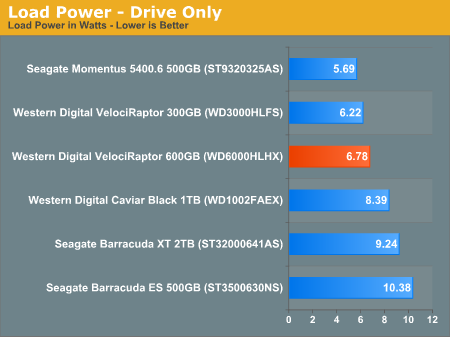
Load power is a similar story. The new drive uses a bit more than the old one, but still far less than any 7200 RPM 3.5" drive.
Noise
At 10,000 RPM these things are going to be louder than your standard 3.5" desktop hard drive. To find out how loud I put a sound meter 1" away from the front of the drive and measured pressure at both idle and while performing a torture 4K random write test. The torture test basically keeps the drive in constant seek mode so it's a good indication of how loud the drive will be when it's really crunching away.
Note that the system these drives are connected to is my standard SSD testbed, which is a fairly high end desktop that isn't optimized for noise. The decibel readings may be high (particularly because of the 1" distance they were taken at) but they will give you an accurate comparison of which drives will be the loudest.
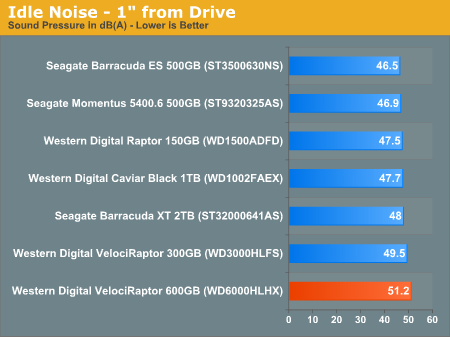
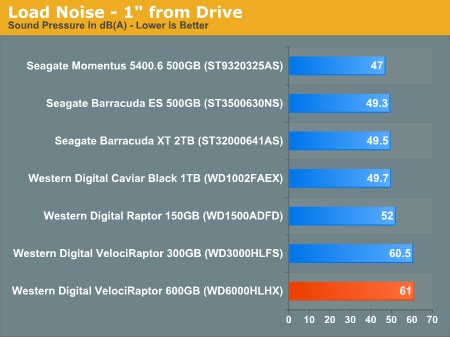
Obviously these 10K RPM drives are loud when they're accessed. The new VR is not much louder than the old one, but compared to a newer 7200 RPM drive they are noticeably louder when seeking. At idle or when performing sequential operations the gap is far narrower, but under load it's pronounced. These drives have never been for silent PCs.


77 Comments
View All Comments
vol7ron - Tuesday, April 6, 2010 - link
Agreed, it could be done, but it would also cause more confusion when you could see data in one place, but not in another. Not to mention, it's probably easier not to have to worry about it from an editor's standpoint - a bad excuse, but probably true.vol7ron
Muon - Tuesday, April 6, 2010 - link
Skewing the graphs is a ludicrous argument not to include SSD in the test. Why not use a logarithmic scale? I guess maybe people in the USA are too dumb to understand such graphs and would think the performance difference is much smaller then it really is.Earthmonger - Tuesday, April 6, 2010 - link
What would be the point of including SSD results?Would you compare a horse and buggy to a turbo-diesel 18-wheeler?
A wax candle to a halogen headlamp?
HotFoot - Tuesday, April 6, 2010 - link
People aren't really selling oxen and wagons to compete with 18-wheelers, whereas the Raptor here is a new product brought into the high-performance storage for desktops market. It certainly is competing against SSDs or a combination of SSD+HDD.I think the general consensus is if you're wanting a lot of performance in a desktop, you'd do better to take the $330 and buy an 80 GB SSD and a 1 TB HDD. I think, given it's about the same price for nearly double the storage capacity, it's be a VERY interesting combination to see on the performance charts.
This entire article basically starts out with the understanding that the new Raptors were obsolete before they ever launched to market.
+
Anand Lal Shimpi - Tuesday, April 6, 2010 - link
The assumption here is someone who wants a VelociRaptor for whatever reason has already ruled out an SSD. If I threw in SSD results it'd be very difficult to make comparisons between the VR and other hard drives as they'd get compressed in the chart.In the not too distant future we'll allow cross technology comparisons between HDDs and SSDs in Bench, but until then I figured just pointing folks at Bench if they wanted SSD results would suffice.
Take care,
Anand
jimhsu - Wednesday, April 7, 2010 - link
Not exactly. Even using this drive in lieu of a SSD for a boot drive is "stupid" (which I think it is), people with hundreds of gigabytes of Steam games or such simply aren't satisfied with the performance of a 1 TB drive. Putting 500 GB of games on SSD is ... expensive. Plus as I have shown in some forum posts, *most* modern games aren't so sensitive to random read/write rates anyways, so the benefit of a SSD is less than for general apps. (MMORPGs, particularly WoW in my testing, are a very clear exception)vol7ron - Tuesday, April 6, 2010 - link
@Muon:
"Skewing the graphs is a ludicrous argument not to include SSD in the test."
I'm guessing most figures from these tests are not done all at once. The charts are more likely a compilation of all the singular tests for that product, for that test bed. Meaning one test may have been run a month ago. Therefore, the SSDs are included in the tests, the results are just posted someplace else. -- go check the storage bench
"Why not use a logarithmic scale?"
Charts are included to have something visible and simple, not something you want to have think about to understand what it represents - that's the whole idea of chart vs table. Bar graphs are perfect because they are proportional and are able to list quanity, rather than a power or base of that quanity. Additionally, how would propose introducing a logarithmic chart - instituting a trendline? - if you take each value to the same base log, you're going to have the same problem with scale, and if you're using the trendline, your graph may be relational, but it will be also be visually innacurate for this type of data.
"I guess maybe people in the USA are too dumb to understand such graphs and would think the performance difference is much smaller then it really is."
That may be. Again, you'd be losing the quick-glance feature of the charts. Not to mention, AT probably has some simple charting software (or macros) that they use, which would need to be changed. If something is so much different, it's not worth including or modifying the portion of your chart. SSDs are in a league of their own and therefore have their own charts - HDDs are included in them because they won't skew the SSD chart AND the value doesn't need to be legible, all that needs to be seen is that the HDDs are insignificant. Because this particular value is about HDDs, the visual true-value comparison is necessary. You would not get that if an SSD was present.
vol7ron
vol7ron - Tuesday, April 6, 2010 - link
I'm just curious what the Windows index rating is. I know that doesn't really account for anything, but I like looking at that, for some awful reason.RaistlinZ - Tuesday, April 6, 2010 - link
I can buy two Samsung Spinpoint F3 1TB drives ($180.00) and put them in RAID 0 and get way more performance, and way more storage space, for 2/3 of the price of the 450GB Raptor. So what's the point of these Raptors exactly? I still don't see where they fit in.Fastidious - Tuesday, April 6, 2010 - link
Yeah, they seem pointless. I never understood why people buy them. With SSD around now it's just that much worse.