OWC Mercury Extreme SSD - First Look at a 50GB SandForce Drive
by Anand Lal Shimpi on February 26, 2010 12:00 AM EST- Posted in
- Storage
Random Read/Write Speed
This test writes 4KB in a completely random pattern over an 8GB space of the drive to simulate the sort of random writes that you'd see on an OS drive (even this is more stressful than a normal desktop user would see). I perform three concurrent IOs and run the test for 3 minutes. The results reported are in average MB/s over the entire time.
I've had to run this test two different ways thanks to the way the newer controllers handle write alignment. Without a manually aligned partition, Windows XP executes writes on sector aligned boundaries while most modern OSes write with 4K alignment. Some controllers take this into account when mapping LBAs to page addresses, which generates additional overhead but makes for relatively similar performance regardless of OS/partition alignment. Other controllers skip the management overhead and just perform worse under Windows XP without partition alignment as file system writes are not automatically aligned with the SSD's internal pages.
First up is my traditional 4KB random write test, each write here is aligned to 512-byte sectors, similar to how Windows XP might write data to a drive:
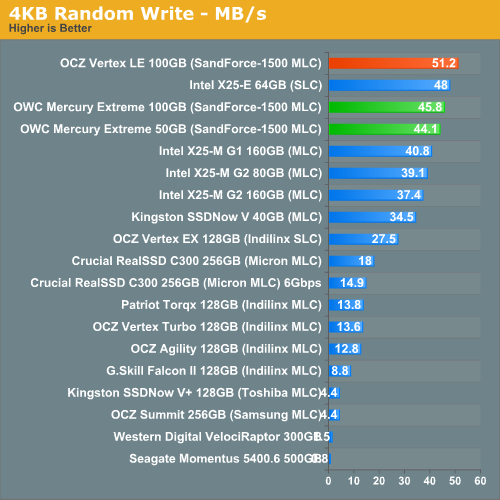
Unaligned 4KB random writes are a bit lower, but nothing tremendous. For some reason both of the OWC Mercury drives actually performed lower than our Vertex LE sample in this test. These should all be the same drive. As we saw in the last review however, in order to better represent performance under modern OSes we need to look at 4K aligned writes since that's what ends up happening most of the time.
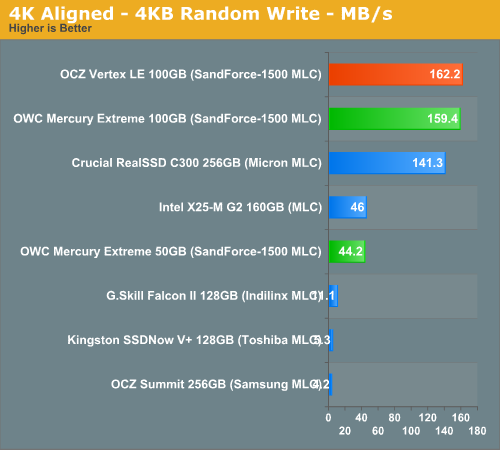
Peak random write performance isn't nearly as good on the 50GB drive. While the 100GB SF-1500 based drives can muster around 160MB/s, the 50GB drive can only manage 44.2MB/s. It's not a deal breaker by any means, and shouldn't really be noticeable in real world usage - but this is the downside to the 50GB drive. Note that at 44.2MB/s, it's still roughly the same speed as Intel's X25-M G2.


74 Comments
View All Comments
Anand Lal Shimpi - Saturday, February 27, 2010 - link
I present the inverse of average latency - IOPS :) Take 1/IOPS and you'll get average latency per IO. I figure it's easier to convey performance this way (bigger numbers mean better performance).Take care,
Anand
ssdreviewer - Saturday, February 27, 2010 - link
as the following posts already pointed out, that's not the case. it would be better you could present directly minimum/average/maximum latency data, rather than IOPS, which has no linear relations with latency under different QD. my applications rely more on latency than random r/w or IOPS, i.e. responsiveness is more crucial here. that being said, i would like to see more direct results from AS SSD and HDTune Pro access time tests. thanks.jimhsu - Saturday, February 27, 2010 - link
That method can't give you information on maximum IO latency (which for me is the critical one, if you're concerned with gaming, real time video streaming, multimedia creation, etc). A drive with 0.1 ms latency but that peaks at 500 ms could be subjectively worse than one with 0.2 ms latency but that peaks at 100 ms.GullLars - Saturday, February 27, 2010 - link
Actually, you need to take Queue Depth (QD) into account. This noted the formula is QD/IOPS, since IOPS = 1/([average accesstime]*[QD]) (this formula is known as Littles Law). If you test at QD=1, 1/IOPS = average accesstime, it's a special case. Since your IOPS tests are at QD 3 and IOPS is represented as bandwidth (IOPS*block size), you find average accesstime (at QD 3) in ms by the formula 3/([bandwidth in MB/s]/4(KB)) (not factoring in MB/KB means s->ms) = 12/[bandwidth in MB/s].From my SSD project a month back, i found average accesstime increases as QD increases, and when QD=#channels average accesstime double when QD doubles. The reason for increased accesstime up to QD=#flash channels are (primarily) in two parts.
1. Statistical distribution says some channels will get multiple requests in queue while some go unused, therefore # of saturated channels < QD. The channels with queue will have single accesstime multiplied with queue lenght for average accesstime.
2. Controller NCQ overhead, the controller adds latency when administrating the queue.
Paladin1211 - Friday, February 26, 2010 - link
I just look at the AnandTech Storage Bench charts, the Kingston V+ performs so good, going neck and neck with Intel and Indilinx MLC in Heavy Workload. How could it be that fast, Anand?Paladin1211 - Friday, February 26, 2010 - link
Ops, I mean SLC, not MLC.Too good to be true...
Paladin1211 - Friday, February 26, 2010 - link
In random write/read test, the V+ scores are so poor. Something is not right here.Anand Lal Shimpi - Saturday, February 27, 2010 - link
The heavy workload is nearly half sequential. It's a heavy downloading and multitasking workload, which has thus far paved the way for a few unexpected strong performers. Remember that most controller makers actually optimize for sequential performance, which this benchmark tests more than any of the other tests. I still can't quite figure out why the Toshiba controller does so well here other than that it must really be tuned for this type of a workload. I've run and re-run the test, the results are always the same.Take care,
Anand
GullLars - Friday, February 26, 2010 - link
Just thought I'd add a link to a couple of graphs i made of IOPS scaling as a function of Queue Depth for 1-4 x25-V in RAID 0 from ICH10R compared to x25-M 80GB and 160GB, and 2 x25-M 80GB RAID 0. These are in the same price range, and the graphs will show why i think Anands reviews don't show the whole truth when there is no test beyond QD 8.link: http://www.diskusjon.no/index.php?app=core&mod...">http://www.diskusjon.no/index.php?app=c...h_rel_mo...
The tests were done by 3 users at a forum i frequent, the username is in front of the setup that was benched.
The IOmeter config run was: 1GB testfile, 30 sec run, 2 sec ramp. Block sizes 0,5KB, 4KB, 16KB, 64KB. Queue Depths 1-128, 2^n stepping. This is a small part of a project from a month back mapping SSD and SSD RAID scaling by block size and queue depth (block sizes 0,5KB-64KB 2^n stepping, QD 1-128 2^n stepping).
ATTO is also nice to show scaling of sequential performance by block size (and possibly queue depth).
cditty - Friday, February 26, 2010 - link
Another great article. I have to give it to you, Anand. Your SSD coverage is by far the best on the net. I have learned so much from your various articles.