OWC Mercury Extreme SSD - First Look at a 50GB SandForce Drive
by Anand Lal Shimpi on February 26, 2010 12:00 AM EST- Posted in
- Storage
Sequential Read/Write Speed
Using the latest build of Iometer I ran a 3 minute long 2MB sequential write test over the entire span of the drive. The results reported are in average MB/s over the entire test length:
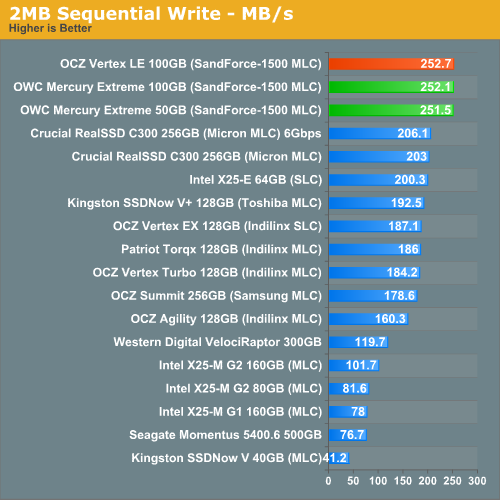
Sequential write speed is completely unaffected by the drop in capacity. The 50GB $229 OWC Mercury Extreme performs just as well as the 100GB version from OWC or OCZ. The three also happen to be the fastest SSDs I've tested at this point in terms of sequential write speed.
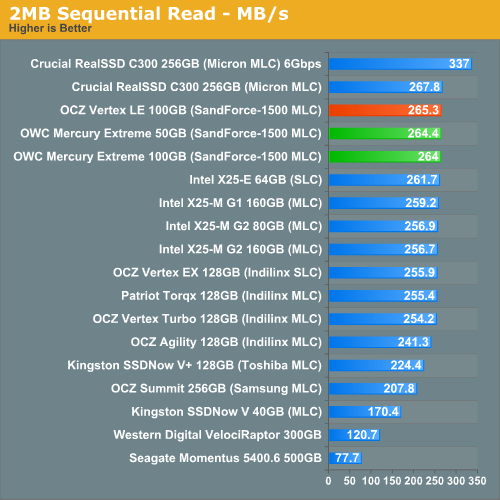
Sequential read speed is also unaffected. There's absolutely no drop in performance here when you go to the smaller capacity. This is why OWC states that the 50GB drive performs just as well as the 100GB and 200GB drives. The next page will show you why that's a false statement.


74 Comments
View All Comments
Anand Lal Shimpi - Saturday, February 27, 2010 - link
I present the inverse of average latency - IOPS :) Take 1/IOPS and you'll get average latency per IO. I figure it's easier to convey performance this way (bigger numbers mean better performance).Take care,
Anand
ssdreviewer - Saturday, February 27, 2010 - link
as the following posts already pointed out, that's not the case. it would be better you could present directly minimum/average/maximum latency data, rather than IOPS, which has no linear relations with latency under different QD. my applications rely more on latency than random r/w or IOPS, i.e. responsiveness is more crucial here. that being said, i would like to see more direct results from AS SSD and HDTune Pro access time tests. thanks.jimhsu - Saturday, February 27, 2010 - link
That method can't give you information on maximum IO latency (which for me is the critical one, if you're concerned with gaming, real time video streaming, multimedia creation, etc). A drive with 0.1 ms latency but that peaks at 500 ms could be subjectively worse than one with 0.2 ms latency but that peaks at 100 ms.GullLars - Saturday, February 27, 2010 - link
Actually, you need to take Queue Depth (QD) into account. This noted the formula is QD/IOPS, since IOPS = 1/([average accesstime]*[QD]) (this formula is known as Littles Law). If you test at QD=1, 1/IOPS = average accesstime, it's a special case. Since your IOPS tests are at QD 3 and IOPS is represented as bandwidth (IOPS*block size), you find average accesstime (at QD 3) in ms by the formula 3/([bandwidth in MB/s]/4(KB)) (not factoring in MB/KB means s->ms) = 12/[bandwidth in MB/s].From my SSD project a month back, i found average accesstime increases as QD increases, and when QD=#channels average accesstime double when QD doubles. The reason for increased accesstime up to QD=#flash channels are (primarily) in two parts.
1. Statistical distribution says some channels will get multiple requests in queue while some go unused, therefore # of saturated channels < QD. The channels with queue will have single accesstime multiplied with queue lenght for average accesstime.
2. Controller NCQ overhead, the controller adds latency when administrating the queue.
Paladin1211 - Friday, February 26, 2010 - link
I just look at the AnandTech Storage Bench charts, the Kingston V+ performs so good, going neck and neck with Intel and Indilinx MLC in Heavy Workload. How could it be that fast, Anand?Paladin1211 - Friday, February 26, 2010 - link
Ops, I mean SLC, not MLC.Too good to be true...
Paladin1211 - Friday, February 26, 2010 - link
In random write/read test, the V+ scores are so poor. Something is not right here.Anand Lal Shimpi - Saturday, February 27, 2010 - link
The heavy workload is nearly half sequential. It's a heavy downloading and multitasking workload, which has thus far paved the way for a few unexpected strong performers. Remember that most controller makers actually optimize for sequential performance, which this benchmark tests more than any of the other tests. I still can't quite figure out why the Toshiba controller does so well here other than that it must really be tuned for this type of a workload. I've run and re-run the test, the results are always the same.Take care,
Anand
GullLars - Friday, February 26, 2010 - link
Just thought I'd add a link to a couple of graphs i made of IOPS scaling as a function of Queue Depth for 1-4 x25-V in RAID 0 from ICH10R compared to x25-M 80GB and 160GB, and 2 x25-M 80GB RAID 0. These are in the same price range, and the graphs will show why i think Anands reviews don't show the whole truth when there is no test beyond QD 8.link: http://www.diskusjon.no/index.php?app=core&mod...">http://www.diskusjon.no/index.php?app=c...h_rel_mo...
The tests were done by 3 users at a forum i frequent, the username is in front of the setup that was benched.
The IOmeter config run was: 1GB testfile, 30 sec run, 2 sec ramp. Block sizes 0,5KB, 4KB, 16KB, 64KB. Queue Depths 1-128, 2^n stepping. This is a small part of a project from a month back mapping SSD and SSD RAID scaling by block size and queue depth (block sizes 0,5KB-64KB 2^n stepping, QD 1-128 2^n stepping).
ATTO is also nice to show scaling of sequential performance by block size (and possibly queue depth).
cditty - Friday, February 26, 2010 - link
Another great article. I have to give it to you, Anand. Your SSD coverage is by far the best on the net. I have learned so much from your various articles.