OCZ's Vertex 2 Pro Preview: The Fastest MLC SSD We've Ever Tested
by Anand Lal Shimpi on December 31, 2009 12:00 AM EST- Posted in
- Storage
Enter the SandForce
OCZ actually announced its SandForce partnership in November. The companies first met over the summer, and after giggling at the controller maker’s name the two decided to work together.
Use the SandForce
Now this isn’t strictly an OCZ thing, far from it. SandForce has inked deals with some pretty big players in the enterprise SSD market. The public ones are clear: A-DATA, OCZ and Unigen have all announced that they’ll be building SandForce drives. I suspected that Seagate may be using SandForce as the basis for its Pulsar drives back when I was first briefed on the SSDs. I won’t be able to confirm for sure until early next year, but based on some of the preliminary performance and reliability data I’m guessing that SandForce is a much bigger player in the market than its small list of public partners would suggest.
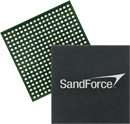 SandForce isn’t an SSD manufacturer, rather it’s a controller maker. SandForce produces two controllers: the SF-1200 and SF-1500. The SF-1200 is the client controller, while the SF-1500 is designed for the enterprise market. Both support MLC flash, while the SF-1500 supports SLC. SandForce’s claim to fame is thanks to their extremely low write amplification, MLC enabled drives can be used in enterprise environments (more on this later).
Both the SF-1200 and SF-1500 use a Tensilica DC_570T CPU core. As SandForce is quick to point out, the CPU honestly doesn’t matter - it’s everything around it that determines the performance of the SSD. The same is true for Intel’s SSD. Intel licenses the CPU core for the X25-M from a third party, it’s everything else that make the drive so impressive.
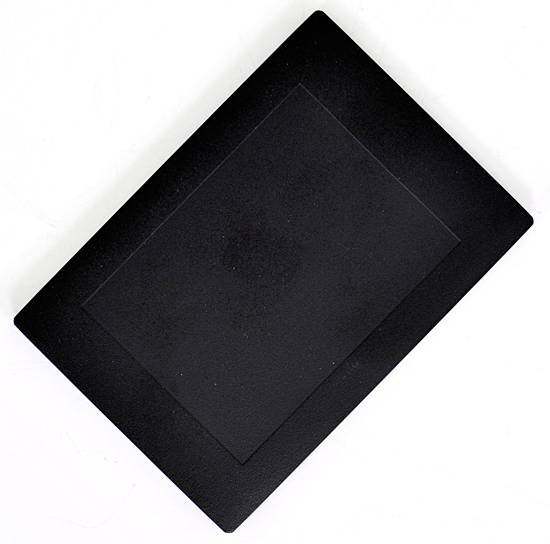
SandForce also exclusively develops the firmware for the controllers. There’s a reference design that SandForce can supply, but it’s up to its partners to buy Flash, layout the PCBs and ultimately build and test the SSDs.
Page Mapping with a Twist
We talked about LBA mapping techniques in The SSD Relapse. LBAs (logical block addresses) are used by the OS to tell your HDD/SSD where data is located in a linear, easy to look up fashion. The SSD is in charge of mapping the specific LBAs to locations in Flash. Block level mapping is the easiest to do, requires very little memory to track, and delivers great sequential performance but sucks hard at random access. Page level mapping is a lot more difficult, requires more memory but delivers great sequential and random access performance.
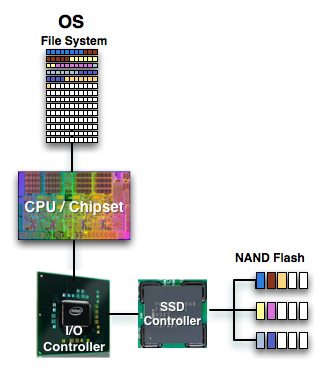
Intel and Indilinx use page level mapping. Intel uses an external DRAM to cache page mapping tables and block history, while Indilinx uses it to do all of that plus cache user data.
SandForce’s controller implements a page level mapping scheme, but forgoes the use of an external DRAM. SandForce believes that it’s not necessary because their controllers simply write less to the flash.


100 Comments
View All Comments
fertilizer - Tuesday, January 5, 2010 - link
First of all, my complements to a great article!It provided me with great insight!
It seems to me that SSD manufacturers are spending a lot of time complying to the world of HDD based Operating Systems.
Would'nt it be time to get OS's to treat a SSD differently than a HDD?
j718 - Tuesday, January 5, 2010 - link
the ocz vertex ex is an slc drive, not mlc as shown in the charts.j718 - Tuesday, January 5, 2010 - link
whoops, sorry, it's just the anandtech storage bench charts that have the ex mislabeled.Donald99 - Monday, January 4, 2010 - link
Any thoughts on potential energy use in mobile environment? Compared to intel MLC. Still better energy efficiencey than a traditional drive?Performance results seem uber.
cliffa3 - Monday, January 4, 2010 - link
Anand,Great article, will be an interesting technology to watch and see how mature it really is.
Question on the timeline for the price drop: When you said 'we'll see 160GB down at $225', were you talking about the mid-year refresh or the end of year next-gen?
MadMan007 - Monday, January 4, 2010 - link
Is it just me or is it inaccurate to mix GB and GiB when calculating overprovisioning at the bottom of page 5? By my reckoning the overprovisioning should be 6.6% (64GB/60GB, 128GB/120GB) not double that from using (64GB/55.9GiB etc)vol7ron - Monday, January 4, 2010 - link
Anand, the right column of the table should be marked as GiB.The last paragraph should take that into consideration. Either the second column should first be converted into GiB, or if it already is (and hard to believe it is), then you could do direct division from there.
The new table:
Adv.(GB) Tot.(GB) Tot.(GiB) User(GiB)
50 64 59.6 46.6
100 128 119.2 93.1
200 256 238.4 186.3
400 512 476.8 372.5
The new percentages should be:
(59.6-46.6) / 59.6 x 100 = 21.8% decrease
(119.2-93.1) / 119.2 x 100 = 21.9% decrease
(238.4-186.3) / 238.4 x 100 = 21.9% decrease
(476.8-372.5) / 476.8 x 100 = 21.9% decrease
And the second table:
Adv.(GB) Tot.(GB) Tot.(GiB) User(GiB)
60 64 59.6 55.9
120 128 119.2 111.8
240 256 238.4 223.5
480 512 476.8 447
The new percentages should be:
(59.6-55.9) / 59.6 x 100 = 6.21% decrease
(119.2-111.8) / 119.2 x 100 = 6.21% decrease
(238.4-223.5) / 238.4 x 100 = 6.25% decrease
(476.8-447) / 476.8 x 100 = 6.25% decrease
Note, I did not use significant figures, so all numbers are approximated, yet suitable - the theoretical value may be slightly different.
vol7ron
vol7ron - Monday, January 4, 2010 - link
Anand, the right column of the table should be marked as GiB.The last paragraph should take that into consideration. Either the second column should first be converted into GiB, or if it already is (and hard to believe it is), then you could do direct division from there.
The new table:
Adv.(GB) Tot.(GB) Tot.(GiB) User(GiB)
50 64 59.6 46.6
100 128 119.2 93.1
200 256 238.4 186.3
400 512 476.8 372.5
The new percentages should be:
(59.6-46.6) / 59.6 x 100 = 21.8% decrease
(119.2-93.1) / 119.2 x 100 = 21.9% decrease
(238.4-186.3) / 238.4 x 100 = 21.9% decrease
(476.8-372.5) / 476.8 x 100 = 21.9% decrease
And the second table:
Adv.(GB) Tot.(GB) Tot.(GiB) User(GiB)
60 64 59.6 55.9
120 128 119.2 111.8
240 256 238.4 223.5
480 512 476.8 447
The new percentages should be:
(59.6-55.9) / 59.6 x 100 = 6.21% decrease
(119.2-111.8) / 119.2 x 100 = 6.21% decrease
(238.4-223.5) / 238.4 x 100 = 6.25% decrease
(476.8-447) / 476.8 x 100 = 6.25% decrease
Note, I did not use significant figures, so all numbers are approximated, yet suitable - the theoretical value may be slightly different.
vol7ron
Guspaz - Sunday, January 3, 2010 - link
Your pricing estimates for Intel's refreshes worry me, and I worry that you're out of touch with SSD pricing.Intel's G2 x25-m 160GB drive currently sells for $500-550, so claims that Intel will be selling 600GB drives at the same price point raise some eyebrows.
kunedog - Monday, January 4, 2010 - link
I couldn't help but roll my eyes a little when I saw that Anand was again making Intel SSD pricing predictions. Even the G1 X-25Ms skyrocketed above his predictions for the G2s:http://www.anandtech.com/storage/showdoc.aspx?i=36...">http://www.anandtech.com/storage/showdoc.aspx?i=36...
And the G1s are still higher at Newegg (the G2s are still a LOT higher). Anand has never acknowledged the stratospheric X-25M G2 pricing and how dead wrong his predictions were. He's kept us updated on negative aspects like the firmware bugs, slow stock/availability of G2s, and lack of TRIM for G1s, but never pricing.