Gateway AMD and Intel Laptops, a Platform Analysis
by Jarred Walton on August 12, 2009 2:00 AM EST- Posted in
- Laptops
Gaming Performance - AMD vs. Intel
Before we get to the gaming results - quit looking ahead and pay attention to this paragraph! - we need to put gaming performance in perspective. These integrated graphics solutions might be the best that AMD and Intel currently offer in laptops, but don't get excited. The fact of the matter is that neither of these solutions is particularly fast when it comes to playing 3D games. We loaded a variety of titles onto the laptops, and after a look at performance using medium detail settings we quickly decided that even the Radeon HD 3200 had no business running anything above minimum detail at 800x600. Okay, that's not entirely true; we did get a few titles to break 30 frames per second at the native 1366x768 LCD resolution, but those games where the exception rather than the rule.
While we're making disclaimers, we also need to mention that Intel's GMA 4500MHD failed to run quite a few games until we force DirectX 9 mode. In fact, out of the 18 titles that we tested, the Intel laptop still failed to run four of them. These four titles would crash to the desktop and nothing we tried fixed the situation. That's pretty bad if you're interested in gaming, but we do have to give Intel some credit: the last time I tried to test gaming compatibility with an Intel IGP (GMA 950), only about one third of the titles would even load properly! Okay, are your expectations set sufficiently low yet? Here we go. (I know… most of you have already skipped these two paragraphs and are staring at the chart. Sigh.)
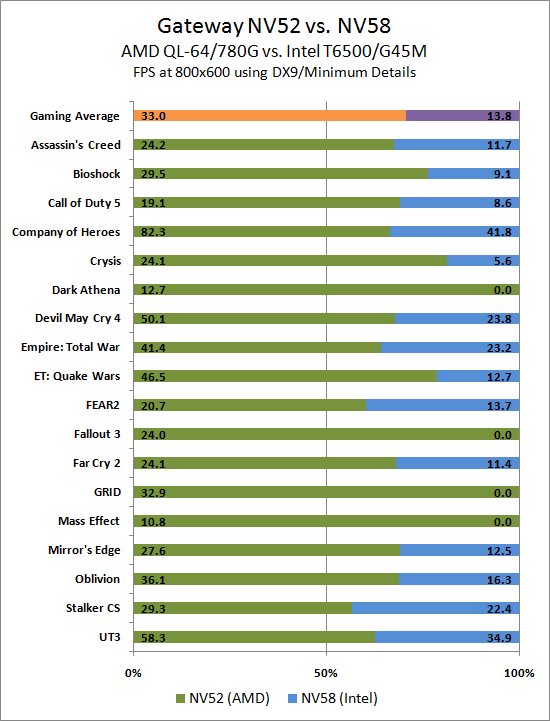
As you probably expected, there's not a single instance where the Intel integrated graphics provide a better gaming experience than the AMD IGP. In fact, the closest Intel gets is in STALKER: Clear Sky where the AMD platform is only 31% faster. Frankly, the fact that Crysis runs at all on Intel (with DX9 mode forced) was a bit surprising, but AMD ended up being a whopping 335% faster so let's not dwell on the achievement. The Chronicles of Riddick: Dark Athena, Fallout 3, Mass Effect, and Race Driver: GRID all failed to run on the Intel IGP. Enemy Territory: Quake Wars is another title that wasn't even close, with AMD's 780G providing 266% better performance than the 4500MHD.
If we add up all the frame rates in all of the titles (counting a zero against Intel for any games that they fail to run properly), the final tally is that the AMD platform ends up providing more than twice the performance of the Intel platform (140% faster) when it comes to gaming. (Incidentally, if we drop the four failed titles along with ETQW and Crysis from the average, AMD's HD 3200 ends up being just 88% faster, so further driver tweaks could still help Intel.) You might not think that's a fair comparison, but if we look at frame rates there are only five titles where Intel managed playable frame rates - and this is at 800x600 with minimum detail settings. Unreal Tournament 3, STALKER: Clear Sky (barely), Company of Heroes, Devil May Cry 4 (again barely), and Empire: Total War manage tolerable performance. Out of all of the games we tested, only Company of Heroes and Unreal Tournament 3 are even remotely playable (20 to 24 FPS) at the native LCD resolution. In fact, the AMD platform provided better performance at the native LCD resolution than Intel manages at 800x600.
Before we get too carried away, we should also mention that there are three games in our test list where neither platform could come anywhere near providing adequate performance: Call of Duty: World at War, Chronicles of Riddick: Dark Athena, and Mass Effect all failed to break 20 FPS at 800x600. Crysis, Assassin's Creed, Fallout 3, and Far Cry 2 aren't much better at less than 25 FPS. So congratulations AMD: your integrated graphics solution manages to walk away with the flyweight boxing title after going up against a sick one-armed man. What happens if we put a real contender in the ring?
First, we need to remember that there are Intel-based laptops that use integrated graphics from NVIDIA - or even ATI HD 3330 for a bit more. That will go a long way towards "leveling" the playing field, considering the ATI HD 3330 is actually faster overall compared to the HD 3200. Most of the people who are concerned with gaming performance also seem to feel battery life is less important, in which case you're far better off getting a laptop with a discrete GPU. How much of a difference does that make? As one example the Acer Aspire AS6920 is $70 more expensive than the Gateway NV58. Battery life will probably be quite a bit worse, but gaming performance should be 3x to 4x faster than the NV52. You can even get an Intel laptop with an ATI HD 4650 that should provide about 5x to 6x the performance of the HD 3200 (though prices for such laptops are noticeably higher, starting at around $800.
Our advice? If you want to play "real" games (i.e. newer 3D titles) on a laptop, spend the money on a laptop that can actually play games. Integrated graphics remains at best a poor solution for 3D games, and that will continue until someone invests a lot more effort in creating a compelling IGP. Honestly, AMD/ATI and NVIDIA are resting on their laurels. It wasn't long ago that Intel IGPs failed to run most games - even many casual games. These days the GMA 4500 is only about half the speed of ATI's HD 3200 solution. Their drivers have come a long way in the compatibility department, and another revision or two to their hardware could see Intel close the gap. We'd really love to see a serious mobile graphics solution that tackles power requirements the same way Intel CPUs do… shutdown inactive "cores" (SPs) to conserve power in 2D tasks, and only power up the SPs when necessary. This is really a question of "when" and not "if", and more notebook manufacturers need to pay attention to this area.
Then again, if all you have is a budget laptop and want to play some games, there are plenty of other alternatives that don't require high-end graphics. Plants vs. Zombies is one option that runs well even on netbooks, and there are countless browser games you can play. If you still want some "high-end" 3D fare, try setting the way back machine for 2003 (or earlier) and check out the classics. One of the joys of PC gaming is that the vast majority of older titles will still run on your modern rig. Diablo/Diablo 2, the earlier Fallouts, Half-Life, WarCraft 3… go relive some gory moments of yesteryear and even your entry-level laptop will feel fast - yes, even the Intel IGP should be fine.
Update
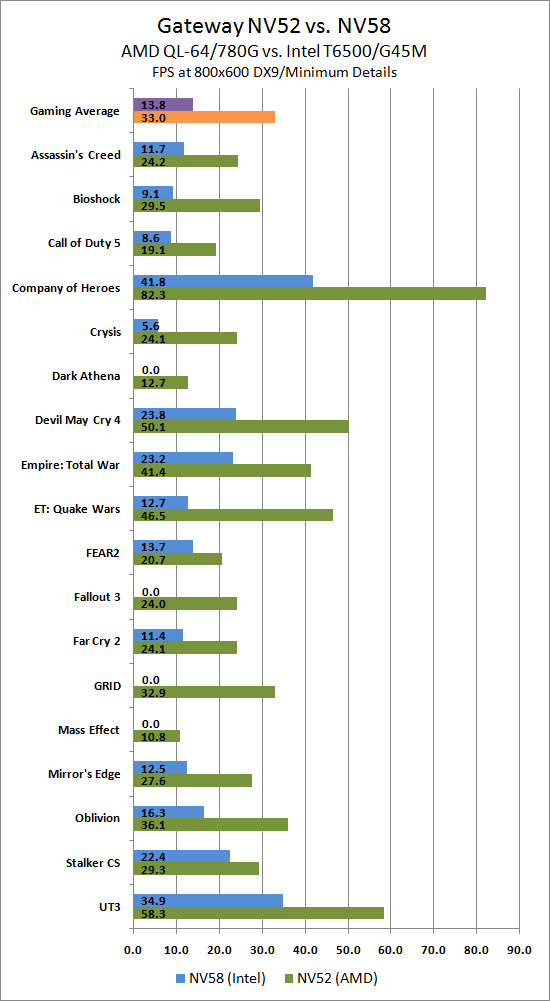
For the gaming tests, this alternate chart will help to provide a better look at where the two IGPs are actually able to provide acceptable performance. Again, this is at 800x600 and minimum detail settings, so this is a best-case scenario in terms of frame rates. Certainly anything in the <15 FPS range isn't playable, and we'd argue that 30 FPS is necessary for an acceptable gaming experience. By that criterion, the GMA 4500MHD can only run Company of Heroes and Unreal Tournament 3 acceptably, while the HD 3200 manages to reach near 30 FPS on half of the titles. Games like the Sims 2/3 and Spore aren't quite as taxing as many of the FPS titles and should run fine on the HD 3200. (We'll try to update later with results of those titles on both systems.)
Update #2
What about casual gaming - you know, The Sims 2/3 and Spore? Maxis has done a great job of providing games that appeal to a much wider audience, though many "serious" gamers aren't as fond of the titles. As a final update to the gaming question, we installed the three latest Maxis titles on these two laptops and used FRAPS to capture frame rates. Unfortunately, there were some difficulties that make these tests a little less useful. Spore for instance appears to force VSYNC, with no way to properly disable the feature. The result is that at 800x600, both laptops ended up reaching 30 FPS on minimum detail settings. The Sims 2/3 also hit apparent frame rate caps, and all three titles were easily playable at 800x600. We settled on testing these games at the native 1366x768 LCD resolution, since we could still play the games without serious difficulty.
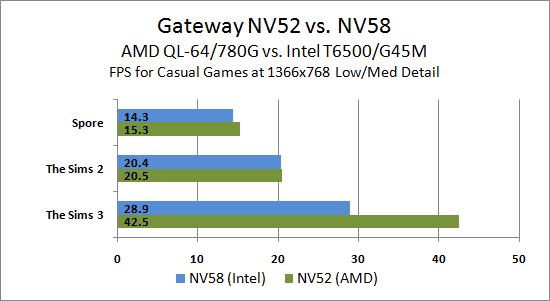
In our tests, two of the three titles ran about the same on the AMD and Intel IGPs. The Sims 2 ends up tied at just over 20 FPS (though VSYNC does not appear active) while Spore gives a slight 6.5% advantage to the AMD platform. The Sims 3 still shows AMD with a comfortable margin of victory at 47% higher frame rates. So what's going on here?
The short summary is that the final rendered images are not 100% identical for a couple reasons. First, we are now dealing with games that have quite a bit of LOD (Level of Detail) adjustments going on, and it looks like certain details get dropped in order to improve frame rates. Second, some rendering errors on the Intel side (i.e. water reflections didn't work in either Sims game at Low detail where we tested) artificially boost the score. Of course, AMD wasn't without rendering errors, but the Gateway NV52 ATI drivers are about six months old (and unfortunately there's no good way to get updated drivers). HDD and CPU performance also appear to be more significant factors in these casual games, allowing Intel to close the gap.
AMD is still the better gaming option, but the fact is we were able to play Spore on low to medium details on the Intel platform all the way from the Single Cell stage up through the Space stage without any real complaints. Maxis is clever in that they decouple mouse cursor updates from the main 3D rendering loop, so your mouse still works properly even when frame rates are in the teens (or lower). Performance is also noticeably better at Low details, but we experienced some texture and rendering corruption at the Civilization stage that we fixed by running Medium details. If you want better rendering quality, the HD 3200 still wins easily, but if you just need a casual gaming fix Intel does better than most would expect in the latest Maxis titles.


67 Comments
View All Comments
samspqr - Wednesday, August 12, 2009 - link
(I mean the one on page 5)JarredWalton - Wednesday, August 12, 2009 - link
As mentioned in the text, the graphs on pages 5 though 8 use a different format. I chose the format because I feel it provides a quick way of looking at relative performance. The percent labels aren't particularly meaningful, since the bars are not in actual percentages (though the bar sizes are).Spacecomber - Wednesday, August 12, 2009 - link
Although I found the article interesting, comparing the advantages of intel based laptops to amd based laptops, I have to agree that the choice of how to represent the data in the charts doesn't really work for me. I understand what the notion was, representing the data as a kind of tug of war between the two platforms, but the utility used to create these charts didn't provide the means to make this clear. I'm a strong believer that charts should be intuitively obvious and that you should be able to interpret them without looking at anything other than what is contained in the chart.These charts have an additional problem when it comes to the representation of the gaming data (or any data where the same measurement unit is being used). You can no longer easily compare performance for the same platform across different games (or whatever the instances being measure are). For example, it is not easy to see in these graphs that some games don't have playable framerates, regardless of the platform.
Anyway, while I'm sympathetic with the effort to try something different, I didn't find that it helped me to comprehend the data any better, and it seemed to be more of a hinderance, instead.
JarredWalton - Wednesday, August 12, 2009 - link
The problem is two-fold: I had a bunch of data to represent, and I didn't want a ton of small charts. I debated just putting in a table, but that seemed a poor way of doing things - especially since I can show the number labels and you get the chart plus table effect. The issue is compounded by units that are not easy to chart with each other - i.e. PCMark05 has some scores in single digits, some in the tens, and some in the hundreds. Do I break PCMark05 scores into 16 different charts, or does the "100% Stacked Bar" chart option provide all the necessary detail?I'm inclined to go with the latter as a reasonable compromise between the various options, and let people spend a few more minutes looking at the data to draw conclusions. It's great when a chart can be "intuitively obvious", but there are times when complex data requires a more complex chart. The net result is that I had a choice between more aesthetically pleasing pages and a single summary chart, or I could make dozens of smaller charts and get a cluttered page.
I understand some people won't like the representation, but I've been playing with the data for the past hour and there's really no option that's as succinct. Some graphs (gaming) lend themselves to other options, but the PCMark05 chart and Application Performance charts have to be split up, put in a table, or something else.
FWIW, I'll post alternative charts in a bit for those that really hate the current charts. However, I'm still a firm believer in requiring people to READ the text. I get the impression that many of the comments have only looked at a small portion of the text and are making a lot of assumptions - assumption which are, not surprisingly, incorrect.
Wellsoul2 - Wednesday, August 12, 2009 - link
The Chart is still backwards compared to the first article onbattery life. Idle is 111 minutes and DVD 242 minutes.
It's reversed from last article.
JarredWalton - Wednesday, August 12, 2009 - link
Sorry... not sure how that happened, other than sorting charts in Excel. For some reason, the top spreadsheet cell showed up on the bottom of the chart, and so I resorted. Apparently I missed the numbers at some point. I'll correct the chart shortly....mczak - Wednesday, August 12, 2009 - link
Hmm, what about the raw numbers which should show minutes runtime? Idle has lowest runtime, DVD playback largest. That definitely looks wrong...Wellsoul2 - Wednesday, August 12, 2009 - link
Yes...looks like you reversed the numbers.whatthehey - Wednesday, August 12, 2009 - link
Reading comprehension is a great thing!"We are using a different format for the graphing than we used previously.... For this chart, equal performance is denoted by the 50% mark in the middle of the chart. A larger bar means better performance, and the numerical results (in minutes) are available for those that prefer raw numbers."
Ah, yes, the percentage marks are entirely misleading! Shame on you AnandTech for making people read! (FWIW, I had no issues reading and interpreting the graphs, but then I'm a computer programmer.)
Ben90 - Wednesday, August 12, 2009 - link
" quit looking ahead and pay attention to this paragraph! " You should have added that to the page before, my screen was already down in the chart when i read this :)