Overclocking Extravaganza: GTX 275's Complex Characteristics
by Derek Wilson on June 4, 2009 5:35 AM EST- Posted in
- GPUs
Memory Overclocking
Data availability is important in the performance of GPUs, and AMD and NVIDIA pack huge amounts of bandwidth into their designs in order to accommodate this need. While AMD's high end parts have moved over to the newer, less tested, GDDR5, NVIDIA will stick with GDDR3 until at least their next architecture revision (though it is still unclear exactly what memory technologies NVIDIA will support beyond the current generation). This does mean that NVIDIA needs twice the number of pins to achieve the same bandwidth (at the same clock speed), but this isn't a huge problem for the already monolithic G80 and GT100 based GPUs.
With the 448-bit wide connection to GDDR3 memory, NVIDIA's GTX 275 needs to run it's RAM at a higher clock speed in order to achieve the same data rate the Radeon 4890 can hit with it's 256-bit GDDR5 bus. Certainly fast GDDR3 has had time to mature and is highly available. This and the fact that demand is still much higher for GDDR3 mean that NVIDIA is saving some money on competitive memory subsystems. But needing a higher baseline clock speed to compete with AMD's solution could mean less overclockability overall.
We were able to get a greater than 23% clock speed increase out of our 4890, but the best we could manage between a couple of GTX 275 samples was a little more than 14%. Starting out with very nearly the same memory bandwidth, our overclocked AMD part comes out ahead in absolute terms.
It is important to remember, however, that absolute bandwidth doesn't matter as much as how well the bandwidth matches the demand of the GPU. This isn't something we can easily ascertain, but our look at the impact of only overclocking memory certainly shows that the bandwidth NVIDIA chose for the GTX 275 is a good match for the core and shader clock speeds with which it is paired.
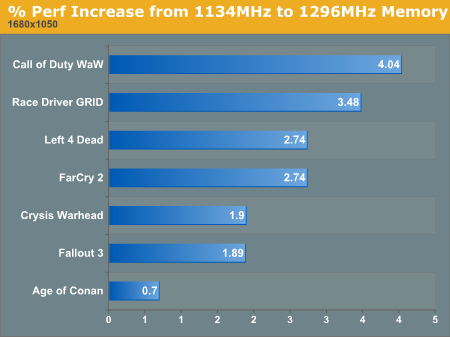
1680x1050 1920x1200 2560x1600
We will be digging deeper into how memory speed impacts performance after we look at the rest of our scaling tests, but without any other assistance, just overclocking memory is not going to gain a lot for the GTX 275.


43 Comments
View All Comments
Hrel - Friday, June 5, 2009 - link
Wow, I guess the guys who programmed WAW and Race Driver did a REALLY crappy job at resource allocation; 30 percent compared to about 8 percent from Left 4 Dead; pretty terrible programming.MonsterSound - Friday, June 5, 2009 - link
I too like the 'change-in-place' resolution graphs, but have to agree that they would be better if the scale was consistent.As far as the 702mhz OC on your 275, that seems like a weak attempt. The retail evga 275 ftw model for example has been binned as an overclocker and stock speed is 713mhz. My MSI 275 FrozrOC is running at 735mhz right now. I can't seem to find mention of which models of the 275 you were testing with, but obviously not the fastest.
respectfully,...
Anonymous Freak - Thursday, June 4, 2009 - link
While I love the 'change-in-place' resolution graphs, they really need to be consistent. Leave games in the same location vertically; and keep the same scale horizontally. That way I can tell at an instant glance what the difference is. I don't like having the range switch from 0-15 to 0-7 to 0-10, plus changing the order of the games, when I click the different resolutions!After all, the only difference that matters on the graphs is the one the individual bars represent. So why go changing the other aspects? Yes, it's "pretty" to have the longest bar the same length, and to always have the graph sorted longest-on-top; but it makes the graph less readable.
For the few graphs that have a bunch of values clustered near each other, plus one or two outliers, just have the outliers run off the edge. For example, in most of your one-variable graphs, a range of 0-10% would be sufficient. Just make sure that for a given resolution set, the range is the same.
yacoub - Thursday, June 4, 2009 - link
This article completely kicks butt! It includes everything I'd want to see in charts, including both % gains and the actual FPS numbers versus other cards, and all with the three most important resolutions.Very, very good article. Please keep up this level of quality - the data and the depth really answer all the major questions readers and enthusiasts would have.
chizow - Thursday, June 4, 2009 - link
Nice job Derek, I've been lobbying for a comparison like this since G80 but nice to see a thorough comparison of the different clock domains and impact on performance.As I suggested in some of your multi-GPU round-up articles, it'd be nice to see similar using CPU clockspeed scaling with a few different types of CPU, say a single i7, a C2Q 9650 and a PII 955 for example, then test with a fast single GPU and observe performance difference at different clockspeeds.
It'd also be interesting to see some comparisons between different GPUs, say 260 to 275 to 280/285 at the same clockspeeds to measure the impact of actual physical differences between the GPU versions.
spunlex - Thursday, June 4, 2009 - link
It looks like a stock GTX 275 beats the 280 in almost every benchmark even at stock speed. Does anyone have any explanation as to why this is happening??I guess GTX 280 sales will be dropping quiet a bit now
PrinceGaz - Thursday, June 4, 2009 - link
This whole idea of the three seperate overclocks (core, shader, memory) being able to simultaneously provide almost their full percentage increase to any single result cannot possibly be right.Imagine you take the situation where a card is overclocked by 10% throughout (instead of 11%, 14%, 18% like you did). Core up 10%. Shaders up 10%. Memory up 10%. Going from your numbers, that would probably have given you about a 20% performance increase in two of the games! Do you really expect us to believe a graphics-card running 10% faster, can give a 20% performance boost to the overall framerate?
How does magically making Core and Shader seperate overclocks allow them to work together to nearly double their effect. If it worked that way, you could split the card up into twenty seperate individually overclockable parts, overclock them all by 10%, and end up with something giving over 3x the performance-- all from a 10% overclock :p
Something else must be happening in addition to what you are doing, and my first priority would be to check the actual speeds the card is running at using a third-party utility which reports not the speed the clocks have been set to, but the actual speed the hardware is running at (I believe RivaTuner does that in real-time in its hardware-monitor charts).
DerekWilson - Thursday, June 4, 2009 - link
I used rivatuner to check the clock speeds. i made very sure things were running at exactly the speeds I specified. At some clocks, the hardware would sort of "round" to the next available clock speed, but the clocks I chose all actually reflect what is going on in hardware.I do see what you are saying, but it doesn't work either the way you think it should or the way that you claim my logic would lead it be. Extrapolating the math I used (which I believe I made clear was not a useful judge of what to expect, but an extreme upper bound that is not achievable) is one thing, but that isn't what is actually "happening" and I don't believe I stated that it was.
Like I said, it is impossible for the hardware to achieve the full theoretical benefit from each of its overclocked subsystems as this would imply that performance was fully limited by each subsystem, which it just not possible.
If I was confusing on that point then I do apologize.
Here's what I know, though: 1) the reported clock speeds are the clock speeds the hardware was actually running at and 2) the performance numbers are definitely correct.
I fully realize I didn't do a good job of explaining why the two above points are both true ... mostly because I have no idea why.
I tried to paint the picture that what actually happened was not impossible, while (I thought) making it clear that I don't actually know what causes the observed effect.
Kibbles - Thursday, June 4, 2009 - link
Great article. I especially liked the 3 linked graphs. One question though. I've been wondering how much power the lastest graphics cards use when you underclock them to the lowest possible while idling, or does the hardware do it automatically? For example, I have my 2D mode on my 8800gtx set to only 200mhz core/shader/memory using nibitor. Or would it matter?DerekWilson - Thursday, June 4, 2009 - link
All the current gen cards do significantly underclock and undervolt themselves in 2D mode. They also turn off parts of the chip not in use.I believe you can set the clocks lower, but the big deal is the voltage as power is proportional to frequency but proportional to the square of voltage. I don't /think/ it would make that much difference in 2D mode, but then it's been years since I tried doing something like that.