Real-world virtualization benchmarking: the best server CPUs compared
by Johan De Gelas on May 21, 2009 3:00 AM EST- Posted in
- IT Computing
Inquisitive Minds Want to Know
Tynopik, a nickname for one of our readers, commented: "Is Nehalem better at virtualization simply because it's a faster CPU? Or are the VM-specific enhancements making a difference?" For some IT professionals that might not matter, but many of our readers are very keen (rightfully so!) to understand the "why" and "how". Which characteristics make a certain CPU a winner in vApus Mark I? What about as we make further progress with our stress testing, profiling, and benchmarking research for virtualization in general?
Understanding how the individual applications behave would be very interesting, but this is close to impossible with our current stress test scenario. We give each of the four VMs four virtual CPUs, and there are only eight physical CPUs available. The result is that the VMs steal time from each other and thus influence each other's results. It is therefore easier to zoom in on the total scores rather than the individual scores. We measured the following numbers with ESXtop:
| Dual Opteron 8389 2.9GHz CPU Usage | |
| Percentage of CPU Time | |
| Web portal VM1 | 19.8 |
| Web portal VM2 | 19.425 |
| OLAP VM | 27.2125 |
| OLTP VM | 27.0625 |
| Total "Work" | 93.5 |
| "Pure" Hypervisor | 1.9375 |
| Idle | 4.5625 |
The "pure" hypervisor percentage is calculated as what is left after subtracting the work that is done in the VMs and the "idle worlds". The work done in the VMs includes the VMM, which is part of the hypervisor. It is impossible, as far as we know, to determine the exact amount of time spent in the guest OS and in the hypervisor. That is the reason why we speak of "pure" hypervisor work: it does not include all the hypervisor work, but it is the part that happens in the address space of the hypervisor kernel.
Notice how the scheduler of ESX is pretty smart as it gives the more intensive OLAP and OLTP VMs more physical CPU time. You could say that those VMs "steal" a bit of time from the web portal VMs. The Nehalem based Xeons shows very similar numbers when it comes to CPU usage:
| Dual Xeon X5570 CPU Usage (no Hyper-Threading) | |
| Percentage of CPU time | |
| Web portal VM1 | 18.5 |
| Web portal VM2 | 17.88 |
| OLAP VM | 27.88 |
| OLTP VM | 27.89 |
| Total "Work" | 92.14 |
| "Pure" Hypervisor | 1.2 |
| Idle | 6.66 |
With Hyper-Threading, we see something interesting. VMware ESXtop does not count the "Hyper-Threading CPUs" as real CPUs but does see that the CPUs are utilized better:
| Dual Xeon X5570 CPU Usage (Hyper-Threading Enabled) | |
| Percentage of CPU time | |
| Web portal VM1 | 20.13 |
| Web portal VM2 | 20.32 |
| OLAP VM | 28.91 |
| OLTP VM | 28.28 |
| Total "Work" | 97.64 |
| "Pure" Hypervisor | 1.04 |
| Idle | 1.32 |
Idle time is reduced from 6.7% to 1.3%.
The Xeon 54XX: no longer a virtualization wretch
It's also interesting that VMmark tells us that the Shanghais and Nehalems are running circles around the relatively young Xeon 54xx platform, while our vApus Mark I tells us that while the Xeon 54xx might not be the first choice for virtualization, it is nevertheless a viable platform for consolidation. The ESXtop numbers you just saw gives us some valuable clues, and the Xeon 54xx "virtualization revival" is a result of the way we test now. Allow us to explain.
In our case, we have eight physical cores with four VMs and four vCPUs each. So on average the hypervisor has to allocate two physical CPUs to each virtual machine. ESXtop shows us that the scheduler plays it smart. In many cases, a VM gets one dual-core die on the Xeon 54xx, and cache coherency messages are exchanged via a very fast shared L2 cache. ESXtop indicates quite a few "core migrations" but never "socket migrations". In other words, the ESX scheduler keeps the virtual machines on the same cores as much as possible, keeping the L2 cache "warm". In this scenario, the Xeon 5450 can leverage a formidable weapon: the very fast and large 6MB that each two cores share. In contrast, two cores working on the same VM have to content themselves with a tiny 512KB L2 and a slower and a smaller L3 cache (4MB per two cores) on Nehalem. The way we tested right now is probably the best case for the Xeon 54xx Harpertown. We'll update with two and three tile results later.
Quad Opteron: room for more
Our current benchmark scenario is not taxing enough for a quad Opteron server:
| Quad Opteron 8389 CPU Usage | |
| Percentage of CPU time | |
| Web portal VM1 | 14.70625 |
| Web portal VM2 | 14.93125 |
| OLAP VM | 23.75 |
| OLTP VM | 23.625 |
| Total "Work" | 77.0125 |
| "Pure" Hypervisor | 2.85 |
| Idle | 21.5625 |
Still, we were curious how a quad machine would handle our virtualization workload, even at 77% CPU load. Be warned that the numbers below are not accurate, but give some initial ideas.
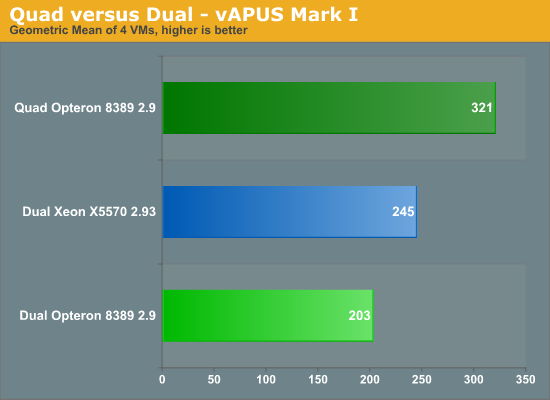
Despite the fact that we are only using 77% of the four CPUs compared to the 94-97% on Intel, the quad socket machine remains out of reach of the dual CPU systems. The quad Shanghai server outperforms the best dual socket Intel by 31% and improves performance by 58% over its dual socket sibling. We expect that once we run with two or three "tiles" (8 or 12 VMs), the quad socket machine will probably outperform the dual shanghai by -- roughly estimated -- 90%. Again, this is a completely different picture than what we see in VMmark.


66 Comments
View All Comments
GotDiesel - Thursday, May 21, 2009 - link
"Yes, this article is long overdue, but the Sizing Server Lab proudly presents the AnandTech readers with our newest virtualization benchmark, vApus Mark I, which uses real-world applications in a Windows Server Consolidation scenario."spoken with a mouth full of microsoft cock
where are the Linux reviews ?
not all of us VM with windows you know..
JohanAnandtech - Thursday, May 21, 2009 - link
A minimum form of politeness would be appreciated, but I am going to assume your were just dissapointed.The problem is that right now the calling circle benchmark runs half as fast on Linux as it does on Windows. What is causing Oracle to run slower on Linux than on Windows is a mystery even to some of the experienced DBA we have spoken. We either have to replace that benchmark with an alternative (probably Sysbench) or find out what exactly happened.
When you construct a virtualized benchmark it is not enough just to throw in a few benchmarks and VMs, you really have to understand the benchmark thoroughly. There are enough halfbaken benchmarks already on the internet that look like a Swiss cheese because there are so many holes in the methodology.
JarredWalton - Thursday, May 21, 2009 - link
Page 4: vApus Mark I: the choices we made"vApus mark I uses only Windows Guest OS VMs, but we are also preparing a mixed Linux and Windows scenario."
Building tests, verifying tests, running them on all the servers takes a lot of time. That's why the 2-tile and 3-tile results are not yet ready. I suppose Linux will have to wait for Mark II (or Mark I.1).
mino - Thursday, May 21, 2009 - link
What you did so far is great. No more words needed.What I would like to see is vApus Mark I "small" where you make the tiles smaller, about 1/3 to 1/4 of your current tiles.
Tile structure shall remain simmilar for simplicity, they will just be smaller.
When you manage to have 2 different tile sizes, you shall be able to consider 1 big + 1 small tile as one "condensed" tile for general score.
Having 2 reference points will allow for evaluating "VM size scaling" situations.
JohanAnandtech - Sunday, May 24, 2009 - link
Can you elaborate a bit? What do you menan by "1/3 of my current tile?" . A tile = 4 VMs. are you talking about small mem footprint or number of VCPUs?Are you saying we should test with a Tile with small VMs and then test afterwards with the large ones? How do you see such "VM scaling" evaluation?
mino - Monday, May 25, 2009 - link
Thanks for response.1/3 I mean smaller VM's. Mostly from the load POW. Probably 1/3 load would go for 1/2 memory footprint.
The point being that currently the is only a single datapont with a specific load-size per tile/per VM.
By "VM scaling" I would like to see what effect woul smaller loads have on overal performance.
I suggest 1/3 or 1/4 the load to get a measurable difference while remaining within reasonable memory/VM scale.
In the end, if you get simmilar overal performance from 1/4 tiles, it may not make sense to include this in future.
Even then the information that your benchmark results can be safely extrapolated to smaller loads would be of a great value by itself.
mino - Monday, May 25, 2009 - link
Eh, that last text of mime looks like a nice gibberish...Clarification nneded:
To be able to run more tiles/box smaller memory footprint is a must.
With smaller mem footprint, smaller DB's are a must.
The end results may not be directly comparable but shall be able to give some reference point, corectly interpreted
Please let me know if this makes sense to you.
There are multiple dimensions to this. I may be easily on the imaginery branch :)
ibb27 - Thursday, May 21, 2009 - link
Can we have a chance to see benchmarks for Sun Virtualbox which is Opensource?winterspan - Tuesday, May 26, 2009 - link
This test is misleading because you are not using the latest version of VMware that supports Intel's EPT. Since AMD's version of this is supported in the older version, the test is not at all a fair representation of their respective performance.Zstream - Thursday, May 21, 2009 - link
Can someone please perform a Win2008 RC2 Terminal Server benchmark? I have been looking everywhere and no one can provide that.If I can take this benchmark and tell my boss this is how the servers will perform in a TS environment please let me know.