The Best Server CPUs part 2: the Intel "Nehalem" Xeon X5570
by Johan De Gelas on March 30, 2009 3:00 PM EST- Posted in
- IT Computing
| OLTP: Dell DVD Store on MS SQL Server 2005 | |
| Operating System | Windows 2008 Enterprise RTM (64-bit) |
| Software | SQL Server 2005 Enterprise x64 SP3 (64-bit) |
| Benchmark software | Dell DVDStore 2 |
| Database Size | 3.5 GB |
| Typical error margin | 2-4% |
DVD Store is a project that the Linux department of Dell developed in 2005 as a test for its internal server laboratory. The DVD Store database schema consists of only eight tables, but it does include stored procedures and transactions. The beauty is that it is available as open source software. This allowed us to turn this into a custom benchmark. With the default settings, the database can only be three sizes: 10MB, 1GB, or 100GB. A 10MB database size is simply too small. A 1GB size does not allow us to scale well, as too much locking contention happens. Those two options are out, but to run DVD Store with a 100GB database as a CPU benchmark, we need to take out a second mortgage on all the houses of our team to pay for the necessary storage racks.
We decided to recompile the test, allowing us to use a 3.5GB database. A 3.5GB database proved to be a good compromise between not needing too much storage speed and making the database scale well to eight cores and beyond. As you can read on our benchmark configuration page, we used a RAID 0 set of six SSDs for the data, and four 15000RPM SAS disks for the logs. We monitored the DQL (Disk Queue Length) to ensure our test was not bottlenecked by the storage subsystem.
Most of the time, our storage subsystem copes well with the transactions (DQL <1), but there are a few brief spikes where the disks are limiting throughput. This means that our fastest CPUs are running at a slightly lower CPU load (Xeon X5570 is at slightly less than 80%) than the slowest CPU (85%). Giving our fastest CPUs an even faster storage system hardly improved performance despite somewhat higher CPU load levels. In reality, it is very unlikely that you will add a few drives because you wish to run your CPU at an 82% instead of 78% CPU load, so we feel this small variation in CPU load is acceptable. This is especially true as the resulting variation in performance is much smaller: we are talking about 2-3% performance variations, well within the error margin of our test.
You can test this OLTP database via a very thin web tier or directly. As the web tier only added noise (it uses the slow ODBC driver!) to our results, we tested directly. All servers were tested in a dual CPU configuration.
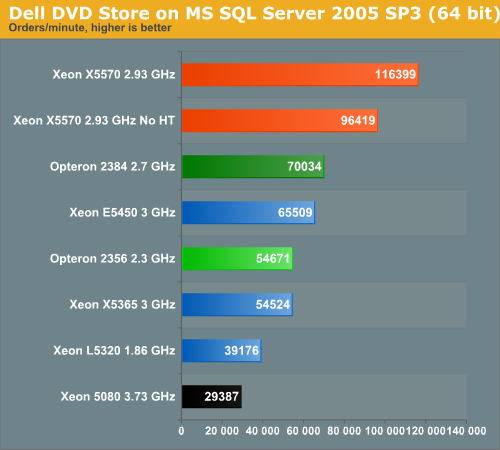
The AMD Shanghai has no trouble leaving the older Xeons behind, even at a lower clock speed. The Xeon 5570 does not play in the same class. Thanks to SMT, it is capable of outperforming its older brother by 78% and the competition by 66%. Hyper-Threading gives the Xeon 5570 a 21% performance boost.
One Xeon 5570 server is capable of replacing 3 to 4 older server systems based on the Xeon 50xx series.


44 Comments
View All Comments
snakeoil - Monday, March 30, 2009 - link
oops it seems that hypertreading is not scaling very well too bad for inteleva2000 - Tuesday, March 31, 2009 - link
Bloody awesome results for the new 55xx series. Can't wait to see some of the larger vBulletin forums online benefiting from these monsters :)ssj4Gogeta - Monday, March 30, 2009 - link
huh?ltcommanderdata - Monday, March 30, 2009 - link
I was wondering if you got any feeling whether Hyperthreading scaled better on Nehalem than Netburst? And if so, do you think this is due to improvements made to HT itself in Nehalem, just do to Nehalem 4+1 instruction decoders and more execution units or because software is better optimized for multithreading/hyperthreading now? Maybe I'm thinking mostly desktop, but HT had kind of a hit or miss reputation in Netburst, and it'd be interesting to see if it just came before it's time.TA152H - Monday, March 30, 2009 - link
Well, for one, the Nehalem is wider than the Pentium 4, so that's a big issue there. On the negative side (with respect to HT increase, but really a positive) you have better scheduling with Nehalem, in particular, memory disambiguation. The weaker the scheduler, the better the performance increase from HT, in general.I'd say it's both. Clearly, the width of Nehalem would help a lot more than the minor tweaks. Also, you have better memory bandwidth, and in particular, a large L1 cache. I have to believe it was fairly difficult for the Pentium 4 to keep feeding two threads with such a small L1 cache, and then you have the additional L2 latency vis-a-vis the Nehalem.
So, clearly the Nehalem is much better designed for it, and I think it's equally clear software has adjusted to the reality of more computers having multiple processors.
On top of this, these are server applications they are running, not mainstream desktop apps, which might show a different profile with regards to Hyper-threading improvements.
It would have to be a combination.
JohanAnandtech - Monday, March 30, 2009 - link
The L1-cache and the way that the Pentium 4 decoded was an important (maybe even the most important) factor in the mediocre SMT performance. Whenever the trace cache missed (and it was quite small, something of the equivalent of 16 KB), the Pentium 4 had only one real decoder. This means that you have to feed two threads with one decoder. In other words, whenever you get a miss in the trace cache, HT did more bad than good in the Pentium 4. That is clearly is not the case in Nehalem with excellent decoding capabilities and larger L1.And I fully agree with your comments, although I don't think mem disambiguation has a huge impact on the "usefullness" of SMT. After all, there are lots of reasons why the ample execution resources are not fully used: branches, L2-cache misses etc.
IntelUser2000 - Tuesday, March 31, 2009 - link
Not only that, Pentium 4 had the Replay feature to try to make up for having such a long pipeline stage architecture. When Replay went wrong, it would use resources that would be hindering the 2nd thread.Core uarch has no such weaknesses.
SilentSin - Monday, March 30, 2009 - link
Wow...that's just ridiculous how much improvement was made, gg Intel. Can't wait to see how the 8-core EX's do, if this launch is any indication that will change the server landscape overnight.However, one thing I would like to see compared, or slightly modified, is the power consumption figures. Instead of an average amount of power used at idle or load, how about a total consumption figure over the length of a fixed benchmark (ie- how much power was used while running SPECint). I think that would be a good metric to illustrate very plainly how much power is saved from the greater performance with a given load. I saw the chart in the power/performance improvement on the Bottom Line page but it's not quite as digestible as or as easy to compare as a straight kW per benchmark figure would be. Perhaps give it the same time range as the slowest competing part completes the benchmark in. This would give you the ability to make a conclusion like "In the same amount of time the Opteron 8384 used to complete this benchmark, the 5570 used x watts less, and spent x seconds in idle". Since servers are rarely at 100% load at all times it would be nice to see how much faster it is and how much power it is using once it does get something to chew on.
Anyway, as usual that was an extremely well done write up, covered mostly everything I wanted to see.
7Enigma - Wednesday, April 1, 2009 - link
I think that is a very good method for determining total power consumption. Obviously this doesn't show cpu power consumption, but more importantly the overall consumption for a given unit of work.Nice thinking.
JohanAnandtech - Wednesday, April 1, 2009 - link
I am trying to hard, but I do not see the difference with our power numbers. This is the average power consumption of one CPU during 10 minutes of DVD-store OLTP activity. As readers have the performance numbers, you can perfectly calculate performance/watt or per KWh. Per server would be even better (instead of per CPU) but our servers were too different.Or am I missing something?