The Best Server CPUs part 2: the Intel "Nehalem" Xeon X5570
by Johan De Gelas on March 30, 2009 3:00 PM EST- Posted in
- IT Computing
The buyer's market approach: our newest testing methods
Astute readers have probably understood what we'll change in this newest server CPU evaluation, but we will let one of the professionals among our readers provide his excellent feedback on the question of improving our evaluations at it.anandtech.com:
"Increase your time horizon. Knowing the performance of the latest and greatest may be important, but most shops are sitting on stuff that's 2-3 years old. An important data point is how the new compares to the old. (Or to answer management's question: what does the additional money get us vs. what we have now? Why should we spend money to upgrade?)"
To help answer this question, we will include a 3 year old system in this review: a dual Dempsey system, which was introduced in the spring of 2006. The Dempsey or Xeon 5080 server might even be "too young", but as it is based on the "Blackford" chipset, it allows us to use the same FB-DIMMs as can be found in new Harpertown (Xeon 54xx) systems. That is important as most of our tests require quite large amounts of memory.
A 3.73GHz Xeon 5080 Dempsey performed roughly equal to a 2.3GHz Xeon 51xx Woodcrest and 2.6GHz dual-core Opteron in SAP and TPC-C. That should give you a few points of comparison, even though none of them are very meaningful. After all, we are using this old reference system to find out if the newest CPU is 2, 5, or 10 times faster; a few percent or more does not matter in that case.
In our Shanghai review, we radically changed our benchmark methodology. Instead of throwing every software box we happen to have on the shelf and know very well at our servers, we decided that the "buyers" should dictate our benchmark mix. Basically, every software type that is really important should have at least one and preferably two representatives in the benchmark suite. In the table below, you will find an overview of the software types servers are bought for and the benchmarks you can find in this review. If you want more detail about each of these software packages, please refer to this page.
| Benchmark Overview | ||
| Server Software Market | Importance | Benchmarks used |
| ERP, OLTP | 10-14% | SAP SD 2-tier (Industry Standard benchmark) Oracle Charbench (Free available benchmark) Dell DVD Store (Open Source benchmark tool) |
| Reporting, OLAP | 10-17% | MS SQL Server (Real world + vApus) |
| Collaborative | 14-18% | MS Exchange LoadGen (MS own load generator for MS Exchange) |
| Software Dev. | 7% | Not yet |
| e-mail, DC, file/print | 32-37% | MS Exchange LoadGen |
| Web | 10-14% | MCS eFMS (Real World + vApus) |
| HPC | 4-6% | LS-DYNA, LINPACK (Industry Standard) |
| Other | 2%? | 3DSMax (Our own bench) |
| Virtualization | 33-50% | VMmark (Industry standard) vApus test (in a later review) |
The combination of an older reference system and real world benchmarks that closely match the software that servers are bought for should offer you a new and better way of comparing server CPUs. We complement our own benchmarks with the more reliable industry standard benchmarks (SAP, VMmark) to reach this goal.
A look inside the lab
We had two weeks to test Nehalem, and tests like the exchange tests and the OLTP tests take more than half a day to set up and perform - not to mention that it sometimes takes months to master them. Understanding how to properly configure a mail server like Exchange is completely different from configuring a database server. It is clear that our testing is now clearly beyond what one person needs to know to perform all these tests. I would like to thank my colleagues at the Sizing Servers Lab for helping to perform all this complicated testing: Tijl Deneut, Liz Van Dijk, Thomas Hofkens, Joeri Solie, and Hannes Fostie. The Sizing Servers Lab is part of Howest, which is part of the Ghent University in Belgium. The most popular parts of our research are published here at it.anandtech.com.
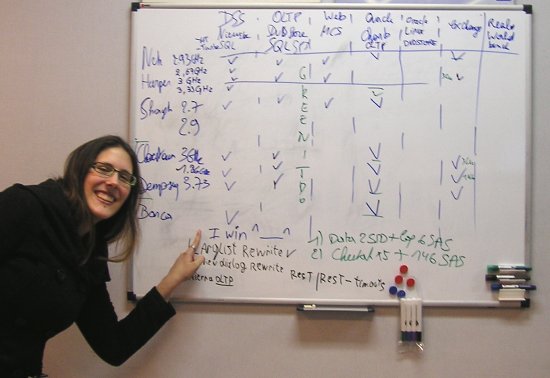
Liz proudly showing that she was first to get the MS SQL Server testing done. Notice the missing parts: the Shanghai at 2.9GHz (still in the air) and the Linux Oracle OLTP test that we are still trying to get right.
The SQL Server and website testing was performed with vApus, or "Virtual Application Unique Stress testing" tool. This tool took our team led by Dieter Vandroemme two years of research and programming, but it was well worth it. It allows us to stress test real world databases, websites, and other applications with the real logs that applications produce. vApus simulates the behavior not just by replaying the logs, but by intelligently choosing the actions that real users would perform using the different statistical distributions.
 |
You can see vApus in action in the picture above. Note that the errors are time-outs. For each selection of concurrent users we see the number of responses and the average response time. It is possible to dig deeper to examine the response time of each individual action. An action is one or more queries (Databases) or a number of URLs that for example are necessary to open one webpage.
The reason why we feel that it is important to use real world applications of lesser-known companies is that these kind of benchmarks are impossible to optimize for. Manufacturers sometimes include special optimizations in their JVM, compilers, and other developer tools with the sole purpose of gaining a few points in well-known benchmarks. These benchmarks allows us to perform a real world sanity check.


44 Comments
View All Comments
snakeoil - Monday, March 30, 2009 - link
oops it seems that hypertreading is not scaling very well too bad for inteleva2000 - Tuesday, March 31, 2009 - link
Bloody awesome results for the new 55xx series. Can't wait to see some of the larger vBulletin forums online benefiting from these monsters :)ssj4Gogeta - Monday, March 30, 2009 - link
huh?ltcommanderdata - Monday, March 30, 2009 - link
I was wondering if you got any feeling whether Hyperthreading scaled better on Nehalem than Netburst? And if so, do you think this is due to improvements made to HT itself in Nehalem, just do to Nehalem 4+1 instruction decoders and more execution units or because software is better optimized for multithreading/hyperthreading now? Maybe I'm thinking mostly desktop, but HT had kind of a hit or miss reputation in Netburst, and it'd be interesting to see if it just came before it's time.TA152H - Monday, March 30, 2009 - link
Well, for one, the Nehalem is wider than the Pentium 4, so that's a big issue there. On the negative side (with respect to HT increase, but really a positive) you have better scheduling with Nehalem, in particular, memory disambiguation. The weaker the scheduler, the better the performance increase from HT, in general.I'd say it's both. Clearly, the width of Nehalem would help a lot more than the minor tweaks. Also, you have better memory bandwidth, and in particular, a large L1 cache. I have to believe it was fairly difficult for the Pentium 4 to keep feeding two threads with such a small L1 cache, and then you have the additional L2 latency vis-a-vis the Nehalem.
So, clearly the Nehalem is much better designed for it, and I think it's equally clear software has adjusted to the reality of more computers having multiple processors.
On top of this, these are server applications they are running, not mainstream desktop apps, which might show a different profile with regards to Hyper-threading improvements.
It would have to be a combination.
JohanAnandtech - Monday, March 30, 2009 - link
The L1-cache and the way that the Pentium 4 decoded was an important (maybe even the most important) factor in the mediocre SMT performance. Whenever the trace cache missed (and it was quite small, something of the equivalent of 16 KB), the Pentium 4 had only one real decoder. This means that you have to feed two threads with one decoder. In other words, whenever you get a miss in the trace cache, HT did more bad than good in the Pentium 4. That is clearly is not the case in Nehalem with excellent decoding capabilities and larger L1.And I fully agree with your comments, although I don't think mem disambiguation has a huge impact on the "usefullness" of SMT. After all, there are lots of reasons why the ample execution resources are not fully used: branches, L2-cache misses etc.
IntelUser2000 - Tuesday, March 31, 2009 - link
Not only that, Pentium 4 had the Replay feature to try to make up for having such a long pipeline stage architecture. When Replay went wrong, it would use resources that would be hindering the 2nd thread.Core uarch has no such weaknesses.
SilentSin - Monday, March 30, 2009 - link
Wow...that's just ridiculous how much improvement was made, gg Intel. Can't wait to see how the 8-core EX's do, if this launch is any indication that will change the server landscape overnight.However, one thing I would like to see compared, or slightly modified, is the power consumption figures. Instead of an average amount of power used at idle or load, how about a total consumption figure over the length of a fixed benchmark (ie- how much power was used while running SPECint). I think that would be a good metric to illustrate very plainly how much power is saved from the greater performance with a given load. I saw the chart in the power/performance improvement on the Bottom Line page but it's not quite as digestible as or as easy to compare as a straight kW per benchmark figure would be. Perhaps give it the same time range as the slowest competing part completes the benchmark in. This would give you the ability to make a conclusion like "In the same amount of time the Opteron 8384 used to complete this benchmark, the 5570 used x watts less, and spent x seconds in idle". Since servers are rarely at 100% load at all times it would be nice to see how much faster it is and how much power it is using once it does get something to chew on.
Anyway, as usual that was an extremely well done write up, covered mostly everything I wanted to see.
7Enigma - Wednesday, April 1, 2009 - link
I think that is a very good method for determining total power consumption. Obviously this doesn't show cpu power consumption, but more importantly the overall consumption for a given unit of work.Nice thinking.
JohanAnandtech - Wednesday, April 1, 2009 - link
I am trying to hard, but I do not see the difference with our power numbers. This is the average power consumption of one CPU during 10 minutes of DVD-store OLTP activity. As readers have the performance numbers, you can perfectly calculate performance/watt or per KWh. Per server would be even better (instead of per CPU) but our servers were too different.Or am I missing something?