The Best Server CPUs part 2: the Intel "Nehalem" Xeon X5570
by Johan De Gelas on March 30, 2009 3:00 PM EST- Posted in
- IT Computing
Power Consumption
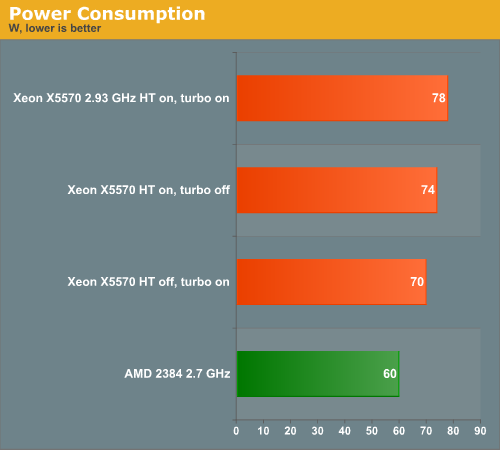
The method we used does not allow us to determine the absolute idle power numbers very accurately, but it seems that Xeon X5570 consumes 8W to 10W less when running at idle. Again, all these numbers have a pretty high margin of error, but they are accurate enough to say that the Opteron 2384 consumes quite a bit less at full load while the latest Xeon is clearly the winner when you are running idle. If your application is running close to idle most of the time, with a few spikes at some parts of the day, the Xeon is the performance/watt champion.
The only question is what happens if the server is running most of the time at relatively high load (for example thanks to virtualization)? Then we have to remember that the CPU is only part of a complete server. Let us assume that the Nehalem server consumes 320W (which is close to what we measured). A similar AMD Opteron server can then save about 18W per CPU, and 1W per DIMM as high speed DDR3 is a bit more power hungry than DDR2 (which runs at a lower speed). We assume that we use six DIMMs per CPU.
| Power Comparison | |||
| Power consumption | Performance | Performance/Watt | |
| Intel X5570 2.93GHz | 320 | 116399 | 363.7469 |
| AMD | 270 | 70034 | 259.3852 |
We could say that the Nehalem is winning by a margin of about 40%. Now, it is clear that the absolute winner is difficult to determine; it all depends on your applications. Still, it is clear that when you compare the best Intel and AMD CPUs, the best performance/Watt figures come from Intel by pretty large margin.


44 Comments
View All Comments
snakeoil - Monday, March 30, 2009 - link
oops it seems that hypertreading is not scaling very well too bad for inteleva2000 - Tuesday, March 31, 2009 - link
Bloody awesome results for the new 55xx series. Can't wait to see some of the larger vBulletin forums online benefiting from these monsters :)ssj4Gogeta - Monday, March 30, 2009 - link
huh?ltcommanderdata - Monday, March 30, 2009 - link
I was wondering if you got any feeling whether Hyperthreading scaled better on Nehalem than Netburst? And if so, do you think this is due to improvements made to HT itself in Nehalem, just do to Nehalem 4+1 instruction decoders and more execution units or because software is better optimized for multithreading/hyperthreading now? Maybe I'm thinking mostly desktop, but HT had kind of a hit or miss reputation in Netburst, and it'd be interesting to see if it just came before it's time.TA152H - Monday, March 30, 2009 - link
Well, for one, the Nehalem is wider than the Pentium 4, so that's a big issue there. On the negative side (with respect to HT increase, but really a positive) you have better scheduling with Nehalem, in particular, memory disambiguation. The weaker the scheduler, the better the performance increase from HT, in general.I'd say it's both. Clearly, the width of Nehalem would help a lot more than the minor tweaks. Also, you have better memory bandwidth, and in particular, a large L1 cache. I have to believe it was fairly difficult for the Pentium 4 to keep feeding two threads with such a small L1 cache, and then you have the additional L2 latency vis-a-vis the Nehalem.
So, clearly the Nehalem is much better designed for it, and I think it's equally clear software has adjusted to the reality of more computers having multiple processors.
On top of this, these are server applications they are running, not mainstream desktop apps, which might show a different profile with regards to Hyper-threading improvements.
It would have to be a combination.
JohanAnandtech - Monday, March 30, 2009 - link
The L1-cache and the way that the Pentium 4 decoded was an important (maybe even the most important) factor in the mediocre SMT performance. Whenever the trace cache missed (and it was quite small, something of the equivalent of 16 KB), the Pentium 4 had only one real decoder. This means that you have to feed two threads with one decoder. In other words, whenever you get a miss in the trace cache, HT did more bad than good in the Pentium 4. That is clearly is not the case in Nehalem with excellent decoding capabilities and larger L1.And I fully agree with your comments, although I don't think mem disambiguation has a huge impact on the "usefullness" of SMT. After all, there are lots of reasons why the ample execution resources are not fully used: branches, L2-cache misses etc.
IntelUser2000 - Tuesday, March 31, 2009 - link
Not only that, Pentium 4 had the Replay feature to try to make up for having such a long pipeline stage architecture. When Replay went wrong, it would use resources that would be hindering the 2nd thread.Core uarch has no such weaknesses.
SilentSin - Monday, March 30, 2009 - link
Wow...that's just ridiculous how much improvement was made, gg Intel. Can't wait to see how the 8-core EX's do, if this launch is any indication that will change the server landscape overnight.However, one thing I would like to see compared, or slightly modified, is the power consumption figures. Instead of an average amount of power used at idle or load, how about a total consumption figure over the length of a fixed benchmark (ie- how much power was used while running SPECint). I think that would be a good metric to illustrate very plainly how much power is saved from the greater performance with a given load. I saw the chart in the power/performance improvement on the Bottom Line page but it's not quite as digestible as or as easy to compare as a straight kW per benchmark figure would be. Perhaps give it the same time range as the slowest competing part completes the benchmark in. This would give you the ability to make a conclusion like "In the same amount of time the Opteron 8384 used to complete this benchmark, the 5570 used x watts less, and spent x seconds in idle". Since servers are rarely at 100% load at all times it would be nice to see how much faster it is and how much power it is using once it does get something to chew on.
Anyway, as usual that was an extremely well done write up, covered mostly everything I wanted to see.
7Enigma - Wednesday, April 1, 2009 - link
I think that is a very good method for determining total power consumption. Obviously this doesn't show cpu power consumption, but more importantly the overall consumption for a given unit of work.Nice thinking.
JohanAnandtech - Wednesday, April 1, 2009 - link
I am trying to hard, but I do not see the difference with our power numbers. This is the average power consumption of one CPU during 10 minutes of DVD-store OLTP activity. As readers have the performance numbers, you can perfectly calculate performance/watt or per KWh. Per server would be even better (instead of per CPU) but our servers were too different.Or am I missing something?