Unreal Tournament 3 Beta Demo: Top to Bottom GPU Analysis
by Derek Wilson on October 18, 2007 4:00 AM EST- Posted in
- GPUs
Bringing it all Together
With our look at the low end and mainstream markets wrapped up, it's time to take a look at how everything stacks up against everything else. Yes, it is difficult to really see what's going on here, but that's why we broke our GPU coverage down into three bite sized parts. We can pick a monitor size and look at how much graphics power we need to get the performance we want, or just see how much of an advantage one class of cards has over another. As we've already looked at 1024x768, 1280x1024, and 1920x1200 (in our previous article), here we will break out 1600x1200 and then look at scaling.
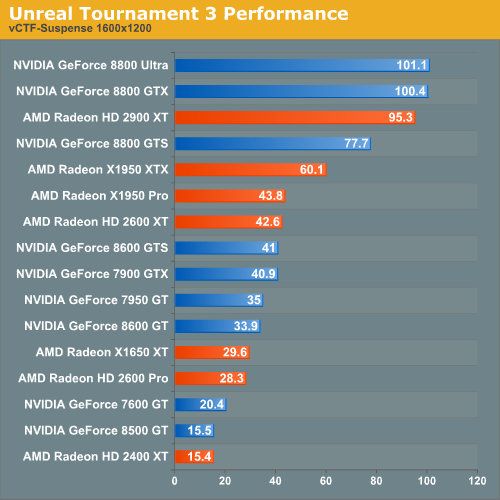
Looking at this graph, the AMD performance advantages are certainly clear. Bringing it all home is our scaling graph:
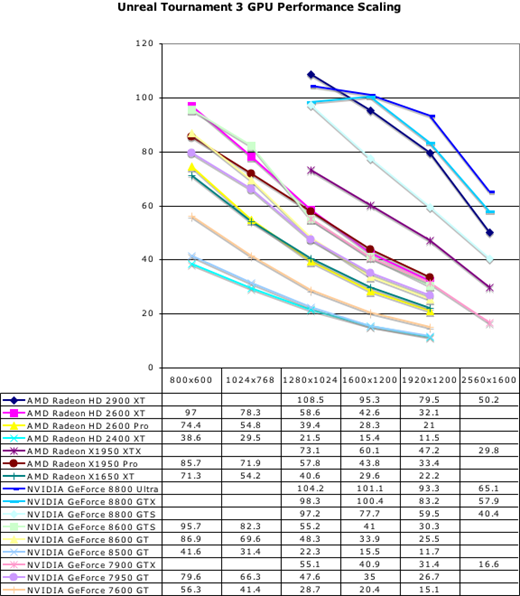
click to enlarge
There isn't much to be said here that hasn't already been covered. We do see more instances of cards scaling differently in this test than usual, and of course, there is the fact that AMD performance is quite good.
Final Words?
Well, these can't really be the final words on Unreal Tournament 3 performance, as running a flyby in the beta version of a demo for the game is more of a preview of what might come to pass. Epic still has time to refine their software, and AMD and (especially) NVIDIA will be working on prepping their drivers for the launch of the game as well.
While these tests did a good job of reproducing the numbers we saw when running around with FRAPS, a full multiplayer timedemo with character models, effects, and high resolution textures (which are not included in this beta demo) could really change what we see here. When we are able to get access to the demoplay feature of UT3, we will certainly revisit our tests with a much more brutal work load.
Hopefully this look at GPU performance under UT3 has been insightful, but our testing really leaves us with more questions than answers. Will AMD remain on top when the game launches? How will final game performance compare to this beta preview? Will the demo playback functionality change the playing field? Stay tuned, and we will answer these questions as soon as we can.
With our look at the low end and mainstream markets wrapped up, it's time to take a look at how everything stacks up against everything else. Yes, it is difficult to really see what's going on here, but that's why we broke our GPU coverage down into three bite sized parts. We can pick a monitor size and look at how much graphics power we need to get the performance we want, or just see how much of an advantage one class of cards has over another. As we've already looked at 1024x768, 1280x1024, and 1920x1200 (in our previous article), here we will break out 1600x1200 and then look at scaling.
Looking at this graph, the AMD performance advantages are certainly clear. Bringing it all home is our scaling graph:

click to enlarge
There isn't much to be said here that hasn't already been covered. We do see more instances of cards scaling differently in this test than usual, and of course, there is the fact that AMD performance is quite good.
Final Words?
Well, these can't really be the final words on Unreal Tournament 3 performance, as running a flyby in the beta version of a demo for the game is more of a preview of what might come to pass. Epic still has time to refine their software, and AMD and (especially) NVIDIA will be working on prepping their drivers for the launch of the game as well.
While these tests did a good job of reproducing the numbers we saw when running around with FRAPS, a full multiplayer timedemo with character models, effects, and high resolution textures (which are not included in this beta demo) could really change what we see here. When we are able to get access to the demoplay feature of UT3, we will certainly revisit our tests with a much more brutal work load.
Hopefully this look at GPU performance under UT3 has been insightful, but our testing really leaves us with more questions than answers. Will AMD remain on top when the game launches? How will final game performance compare to this beta preview? Will the demo playback functionality change the playing field? Stay tuned, and we will answer these questions as soon as we can.


34 Comments
View All Comments
tfranzese - Monday, October 22, 2007 - link
Power consumption is one measure of performance just as frames per second is. There is no standard measure for performance and in this day and age, power consumption is becoming an even more important metric for deciding what the better performer is. I don't know anyone who loves excess heat and a high electric bill.MrKaz - Thursday, October 18, 2007 - link
Thanks for the reply ;)But I was asking to the reviewer (Derek Wilson)
DerekWilson - Thursday, October 18, 2007 - link
I did group cards by performance. Certainly, the 2600 performed quite well for its price. Which I hope was well noted in the article...dm0r - Thursday, October 18, 2007 - link
Very informative and with surprising results, great job as aways...looks like the midrange fight is between the 8600GTS and 2600XT.The thing that most suprises me is the 2600XT beating 1950pro