Intel Core 2 Extreme QX6850 and Massive Price Cuts
by Anand Lal Shimpi on July 16, 2007 3:04 AM EST- Posted in
- CPUs
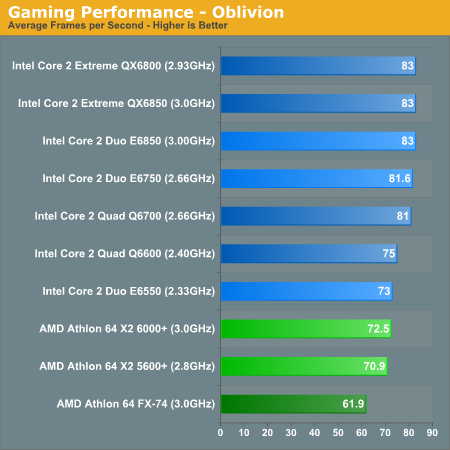
Gaming Performance
Our first 3D game test is our walkthrough of Bruma in the popular RPG Oblivion. This test was run at 1600 x 1200 with Very High quality defaults selected from Oblivion's launcher. FRAPS was used in this benchmark:
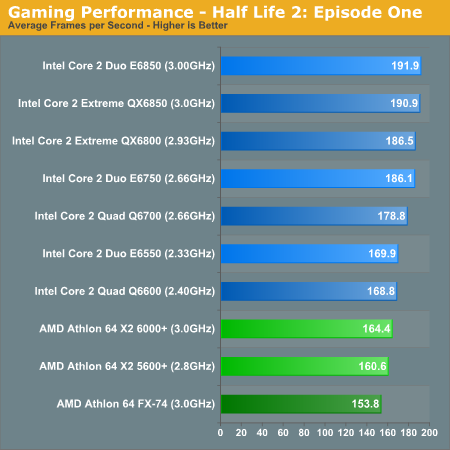
We ran Half Life 2: Episode One at 1600 x 1200, with all settings at their maximum values with the exception of AA/anisotropic filtering, which we left disabled.
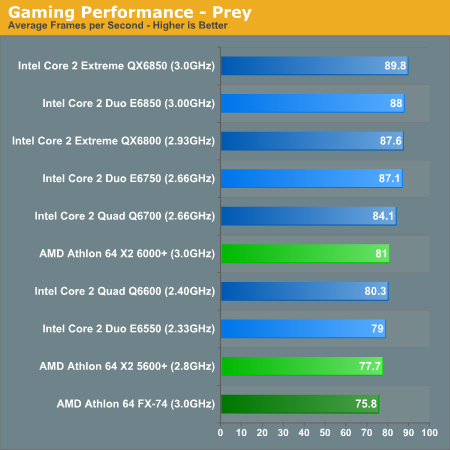
We ran Prey at 1600 x 1200 with High Quality textures, all detail settings were set to their highest options, no AA, and 8X aniso:
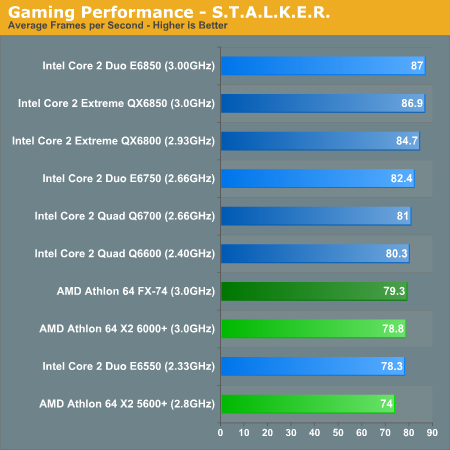
S.T.A.L.K.E.R. was tested at 1024 x 768 with full dynamic lighting enabled and high quality detail settings:
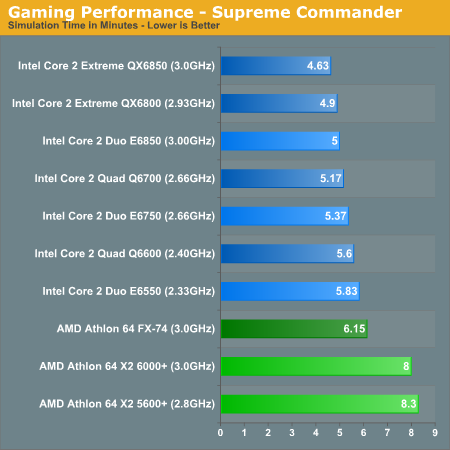
We ran Supreme Commander at 1024 x 768 with medium quality presets. We've changed our Supreme Commander benchmark a bit at the advice of Gas Powered Games' senior engineers. We created a skirmish with 7 AI players and let them duke it out for almost 30 minutes, we saved the replay and then measured the amount of time it took to playback the recording at maximum gamespeed (+10). The figures below are expressed in minutes, lower playback time being better:
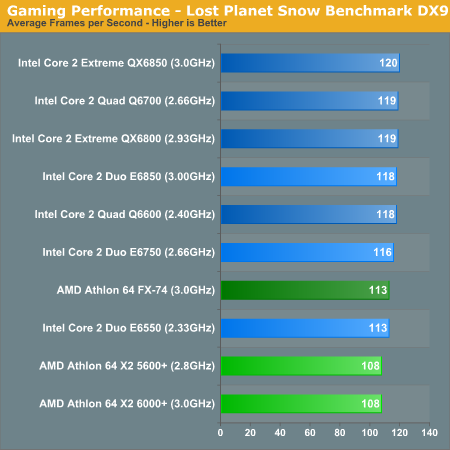
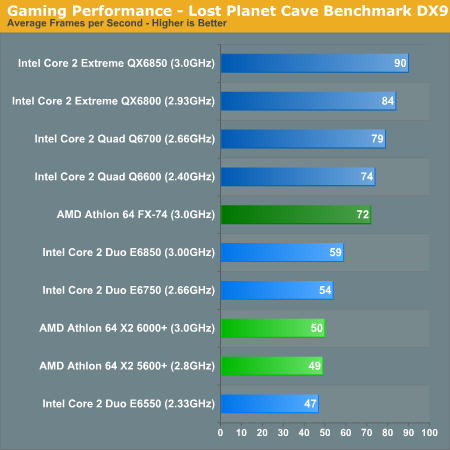
Capcom's Lost Planet demo is available in both DX9 and DX10 flavors, but for this review we used the DX9 version given that we've not been able to find any real benefit to running the DX10 version. We had to run Lost Planet at 800 x 600 with a mixture of high/medium quality settings:


68 Comments
View All Comments
Darkmatterx76 - Monday, July 16, 2007 - link
Nice article. I would like to point out 1 small inconsistancy. On page 12, 4th graph down you have the order for that particular "Lower is better" reversed compared to the others in the article.Also, I do have 1 question. Any idea when Intel will offer non-extreme quad cores at 1333 FSB?
zsdersw - Monday, July 16, 2007 - link
I don't get it. Both are listed as 2.33GHz with 1333FSB and both with 4MB. What's the use of having two models?zsdersw - Monday, July 16, 2007 - link
Nevermind. I found the answer. The 6540 doesn't have Intel Trust Execution technology.. or so I read elsewhere.jay401 - Monday, July 16, 2007 - link
So how does the E6850 ($266 3.0GHz 1333fsb) compare to my existing E4400 ($133 running 1333MHz fsb with a 9x multiplier = 3.0GHz)?That's the test I'd like to see. Half the price but half the cache: Which is better.
bobbyto34 - Monday, July 16, 2007 - link
Your o/c CPU might just be a little hotter :)Otherwise, it should have the same performance approximatively (less cache in E4xxx). But other tests showed that the E4300@3Ghz and could approach the performance of the X6800 !
lplatypus - Monday, July 16, 2007 - link
Here's a little error I spotted on page 2, in case you want to fix it: the QX6850 is not 7MHz faster than the QX6800; it is 70Mhz faster.Gary Key - Monday, July 16, 2007 - link
Fixed.96redformula - Monday, July 16, 2007 - link
I also think the scale would be better from -100 to 100. It makes it easier to distinguish and more visually pleasing.ManuelX - Monday, July 16, 2007 - link
I don't post here much but I had to this time. I simply loved the article. The logic behind the comparison was explained nicely, and the comparisons themselves were super easy to grasp. Good stuff.just4U - Monday, July 16, 2007 - link
I am going to have to agree here. Nicely laid out article with easy comprehensive graph comparison(s). Well done Guys!