Seagate Barracuda 7200.10 750GB: Size Does Matter
by Gary Key on May 18, 2006 9:00 AM EST- Posted in
- Storage
PCMark05
We are utilizing the HDD test suite within PCMark05 for further comparative hard disk scores as it provides a mixture of actual application results and specific read/write percentages utilized within these programs. The program utilizes the RankDisk application within the Intel IPEAK SPT suite of tools to record a trace of disk activity during usage of real world applications. These traces are then replayed to generate performance measurements based upon the actual disk operations within each application. The HDD test suite contains 53% read and 47% write operations with each trace section utilizing varied amounts of read or write operations. Additional information about the test suite can be found in PDF format in the PCMark05 whitepaper.Our test results are based upon the following trace runs:
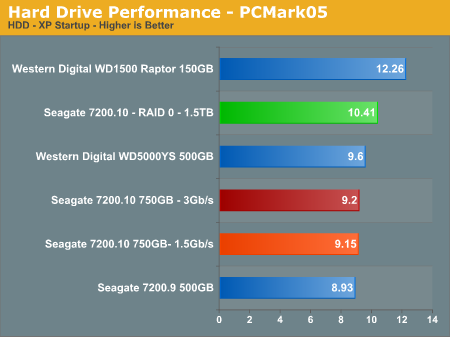
Windows XP Startup: This test consists of 90% reading and 10% writes that tracks XP activities at startup.
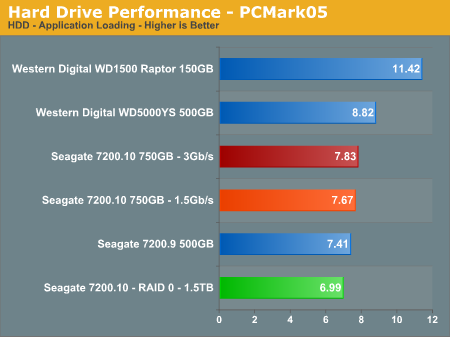
Application Loading: This test consists of 83% reading and 17% writes that tracks the opening and closing of the following programs.
Microsoft Word
Adobe Acrobat Reader
Windows Media Player
3Dmark 2001SE
Leadtek Winfast DVD
Mozilla Internet Browser.
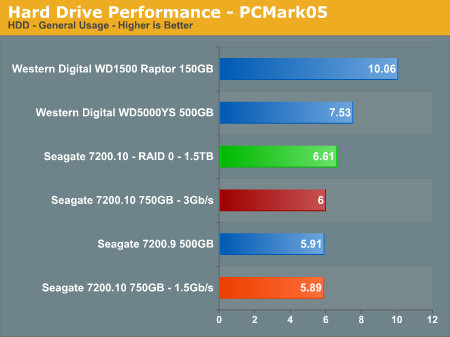
General Hard Disk Drive Usage: This test consists of 60% reading and 40% writes that tracks application usage utilizing the following settings.
Opening a Microsoft Word document, performing grammar check, saving and closing.
Compression and decompression using WinZip
Encrypting and decrypting a file using PowerCrypt
Scanning files for viruses using F-Secure Antivirus
Playing an MP3 file with Winamp
Playing a WAV file with Winamp
Playing a DivX video using DivX codec and Windows Media Player
Playing a WMV video file using Windows Media Player
Viewing pictures using Windows Picture Viewer
Browsing the Internet using Microsoft Internet Explorer
Loading, playing and exiting a game with Tom Clancy's Ghost Recon
Virus Scanning: This test consists of 99.5% read operations as the test tracks the scanning activities of 600MB of files for viruses.
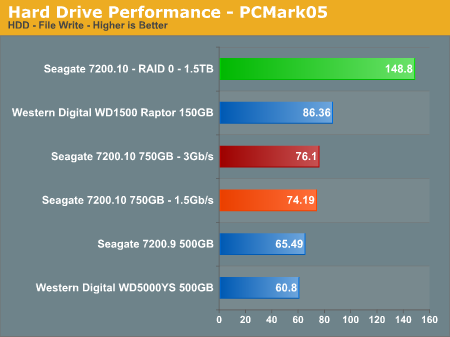
File Write: This test consists of 100% write activities by writing 680MB of files onto the hard disk.
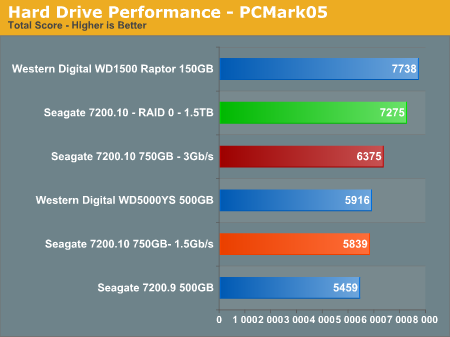
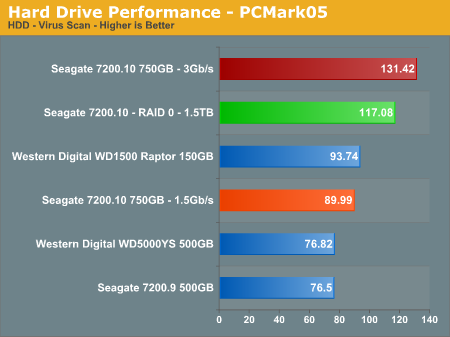
Our PCMark05 numbers follow the same trend with the WD Raptor having a 21% advantage over the Seagate 7200.10 750GB drive in the total score results. The performance delta of implementing SATA II/3Gb/s operation on the Seagate 750GB drive results in an impressive 9% gain over the SATA 1.5Gb/s results. However, after further examination of the numbers the only real improvement comes from the Virus scanning test which shows a 45% increase in the score. The other individual scores are well within the margin of error between benchmark sessions. In our IPEAK virus scan we did not witness the same results and believe the rather short sequential scan of 600MB in data favors the Seagate drive in this test.
The general usage and application benchmarks that represent the majority of daily operations on a typical PC configuration heavily favor the Western Digital drives. The Western Digital 500GB drive makes for an impressive showing in the first three benchmarks and then falls flat on its platter in the File Write test. The Raptor basically eats the competition in all of the benchmarks except the Virus Scan where we obviously have an aberration in the scores.
We have included the RAID 0 results for the Seagate 7200.10 drive array featuring 1.5TB of storage capability. We see a 13% increase in the XP startup benchmark, a 12% decrease in the application loading benchmark, a 1% increase in the general usage score, an 11% decrease in the Virus Scan score, and a 94% increase in the File Write results. As we have stated in previous articles the performance of RAID 0 will improve specific benchmarks but the overall performance in the general application benchmarks did not improve beyond the margin of error in these test results. Although PCMark05 is a very good benchmark, we still have to wonder exactly how the Virus Scan and File Write scores are generated based upon our test results.


44 Comments
View All Comments
Larso - Monday, May 22, 2006 - link
Well, you usually plot dB on a linear axis, taken for granted that the interpreter knows the exponential nature of decibels (+10 dB sounds like doubling the loudness). But since our ears/brain also interpret sound levels in an exponential fashion, its not _that_ misleading...
If you really want to show the soundlevel in a linear fashion, you would have to measure loudness in http://en.wikipedia.org/wiki/Sone">Sone
- Gary: Sorry if I've missed it, when you measured the loudness, was the drive secured to the case with screws, or was it suspended softly? It would be interesting to know how much of the noise was due to vibration, and how much was actual noise emission from the drive.
Perhaps some kind of soft suspension would make the drive noise more bearable, subjectively?
Gary Key - Thursday, May 25, 2006 - link
The drives are suspended via soft rubber bushings in the drive cage in order to equalize the test results between drives (as much as possible). This drive will create an additional low pitch vibration when attached directly but nothing like the sound a Raptor produces when attached directly, subjective opinion of course. :)
TonyB - Thursday, May 18, 2006 - link
how soon till we see 1TB hard drive. 7200.11?Gary Key - Thursday, May 18, 2006 - link
We should see a 960GB drive by Q4. We will see the 1TB+ drives in 2007, maybe earlier depending on how well the new 200GB plus platters test out. Also, if Hitachi or WD press Seagate on the issue in Q4 I am sure it be out early. ;->Zaitsev - Thursday, May 18, 2006 - link
Page 4 reads, "we decided the make the switch at this time as the performance."I enjoyed the article, Gary.
"I would much rather show the benefits of RAID 5, 0+1, 10 in a separate article"
I think that's a great idea, and am looking forward to it.
Gary Key - Thursday, May 18, 2006 - link
The link highlight on the word "applications" right before "we" is hiding the semi-colon somewhat. I will see if we can edit the hyperlink to correct this. :)
Thanks for the comments. We are trying to head in a more technical direction in the storage section. We have some additional audio/video tests coming along with application timer benchmarks that should lighten up the presentation. Also, we did not report WB99, IPEAK Access, Disk Bench, IOMeter, or other benchmarks yet, still gauging what information is valuable, interesting, and required.
JarredWalton - Thursday, May 18, 2006 - link
Actually, he was referring to the word "the" - fixed now, as it should have been "to". :)Zaitsev - Thursday, May 18, 2006 - link
Sorry about that. I will be more clear next time. :)Gary Key - Thursday, May 18, 2006 - link
I will wear my glasses next time.... LOL
peternelson - Thursday, May 18, 2006 - link
Hi,
I can understand why you want to test sound levels as close as 5mm.
However, to someone quickly looking at the results charts without carefully reading the text they might think your db(A)@5mm are comparable with db(A) measurements taken at more conventional distances like 1 metre away.
To avoid such errors being made when comparing BETWEEN reviews, please clearly label the audio charts not just "db" but "db(A)@5mm"