AT Exclusive Preview: The GeForce 7800 GS Hits the Scene
by Derek Wilson & Kristopher Kubicki on November 22, 2005 8:00 PM EST- Posted in
- GPUs
Introduction
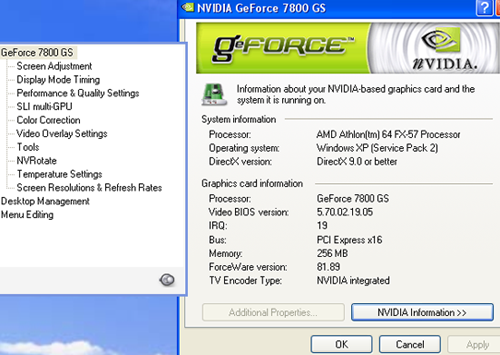
A little over a week ago we received an email from someone claiming to have a GeForce 7800GS. After checking out the card and the emails from NVIDIA confirming that this was in fact a GeForce 7800GS, we knew we had something special on our hands. Today we bring you an engineering prototype that only exists inside NVIDIA, but roadmaps and driver sets indicate this card is the eventual GeForce 6800GT replacement.
We have heard that this part was in the works over at NVIDIA, but we haven't yet heard when this product will be making its way out into the world. Apparently there are board floating around, and since we were lucky enough to get our hands on one we decided to put it through some performance tests and see what it could do. From what we have seen on roadmaps, the performance of the 7800 GS should fall between that of the 6800 GS and the 7800 GT.
Not knowing when this part will actually arrive, or how close to final this part is, means that we could see some small revisions in the card between now and release. Clock speed could change a little bit, but we don't see pipeline configuration changing. If total performance is anything like this in the retail product, we will be quite interested in this part when it is released to the public.


43 Comments
View All Comments
DerekWilson - Wednesday, November 23, 2005 - link
Sorry, most of our tests were run with AF enabled (8x in most cases).The only test that did not include AF was the Splinter Cell: Chaos Theory test with out AA (the 4xAA test also included 8xAF).
Thanks,
Derek Wilson
Jep4444 - Tuesday, November 22, 2005 - link
I'd like to see some benches of the 6800GT or 6800Ultra(preferably the ultra) included just to see how the G70 architecture compares to the Nv40 in terms of "improvements"ShadowVlican - Tuesday, November 22, 2005 - link
6800GT is almost exactly like 6800GS.. so it's a waste of time... most (if not all) reviews of the 6800GS would have already taken care of that comparisonJep4444 - Wednesday, November 23, 2005 - link
the thing about the 6800GS and GT being similar is that they arent uniformly similar, they traded off a few benches and overall the GS is slowerwhat i wanted to see was the fact that they have the same pipeline setup and the 7800GS is clocked similarly so i wanted to see how much the G70 architecture is actually improved
nullpointerus - Tuesday, November 22, 2005 - link
One thing I've been wonderingabout your benchmarking: Some time ago there was a question of whether average framerate should be the sole basis for comparison (IQ issues aside). The argument was that if a card really chokes on certain parts of a scene, having 10% higher average framerate wasn't exactly great. Would it be possible to do a graph of the frames so we could see how much they vary? Or is this not really an issue today?DerekWilson - Tuesday, November 22, 2005 - link
It does matter to some extent, but it is very difficult to do a good job of representing this data. Graphs of instantaneous framerates over time is next to useless in our opinion. Its too hard to actually tell what's going on and way too difficult to properly compare a number of cards without totally destroying readability.I keep voting for boxplots but there's still some debate about whether teaching our readers about statistical analysis is a good idea :-)
I think something that can show outliers, min, max, lower and upper quartiles, and median in as much space as a single bar in a bar graph gets my vote as a good thing. The huge problem is that our graphing engine doesn't support anything nearly this robust. We have been trying to augment our bar graphs with some line graphs generated using a spreadsheet program to show resolution scaling, but I still haven't found a good easy way to generate nice looking boxplots.
Anyone tips?
Leo V - Wednesday, November 23, 2005 - link
Boxplots are an EXTREMELY useful idea, especially the lower-quartile framerate. In fact, the lower quartile may be more useful than the average framerate.The lower quartile shows you how smooth the game is in the "slower" half of the time -- which makes or breaks a game's playability and enjoyment.
Suppose card A averages 60FPS, but the worst half of the time it only averages 20FPS (lower quartile). Carb B averages 50FPS, but is more efficient in relatively complex scenes -- 35FPS lower quartile. Most likely, you want card B, despite its lower "average" framerate. What good is card A when its best 50% of scenes average 100FPS while its worst 50% average 20FPS? A better choice is probably card B, which might average 65FPS in the best 50% and 35FPS in the worst 50%. But average framerates don't show this!
Posting min and max framerates (box whiskers) is useless, since they will be meaningless (and probably random) freak outliers. Min SUSTAINED framerate is good, and it happens to be closely related to the lower quartile number.
Donegrim - Wednesday, November 23, 2005 - link
I reckon if you started to introduce boxplots alongside your standard graphs, readers would catch on pretty fast. People who want the extra information will take the time to work out what it means, and people who don't care can just look at the standard graphs. Or just stick a massive arrow pointing to the mean and leave the rest of the diagram a little more faded.nullpointerus - Wednesday, November 23, 2005 - link
Maybe you could make the boxplots appear instead of the regular graphs on mouse over like you do with some of your IQ comparisons?DerekWilson - Wednesday, November 23, 2005 - link
that would be awesome ... the big problem is making the boxplot though.