The AMD Ryzen Threadripper 1950X and 1920X Review: CPUs on Steroids
by Ian Cutress on August 10, 2017 9:00 AM ESTFeeding the Beast
When frequency was all that mattered for CPUs, the main problem became efficiency, thermal performance, and yields: the higher the frequency was pushed, the more voltage needed, the further outside the peak efficiency window the CPU was, and the more power it consumed per unit work. For the CPU that was to sit at the top of the product stack as the performance halo part, it didn’t particularly matter – until the chip hit 90C+ on a regular basis.
Now with the Core Wars, the challenges are different. When there was only one core, making data available to that core through caches and DRAM was a relatively easy task. With 6, 8, 10, 12 and 16 cores, a major bottleneck suddenly becomes the ability to make sure each core has enough data to work continuously, rather than waiting at idle for data to get through. This is not an easy task: each processor now needs a fast way of communicating to each other core, and to the main memory. This is known within the industry as feeding the beast.
Top Trumps: 60 PCIe Lanes vs 44 PCIe lanes
After playing the underdog for so long, AMD has been pushing the specifications of its new processors as one of the big selling points (among others). Whereas Ryzen 7 only had 16 PCIe lanes, competing in part against CPUs from Intel that had 28/44 PCIe lanes, Threadripper will have access to 60 lanes for PCIe add-in cards. In some places this might be referred to as 64 lanes, however four of those lanes are reserved for the X399 chipset. At $799 and $999, this competes against the 44 PCIe lanes on Intel’s Core i9-7900X at $999.
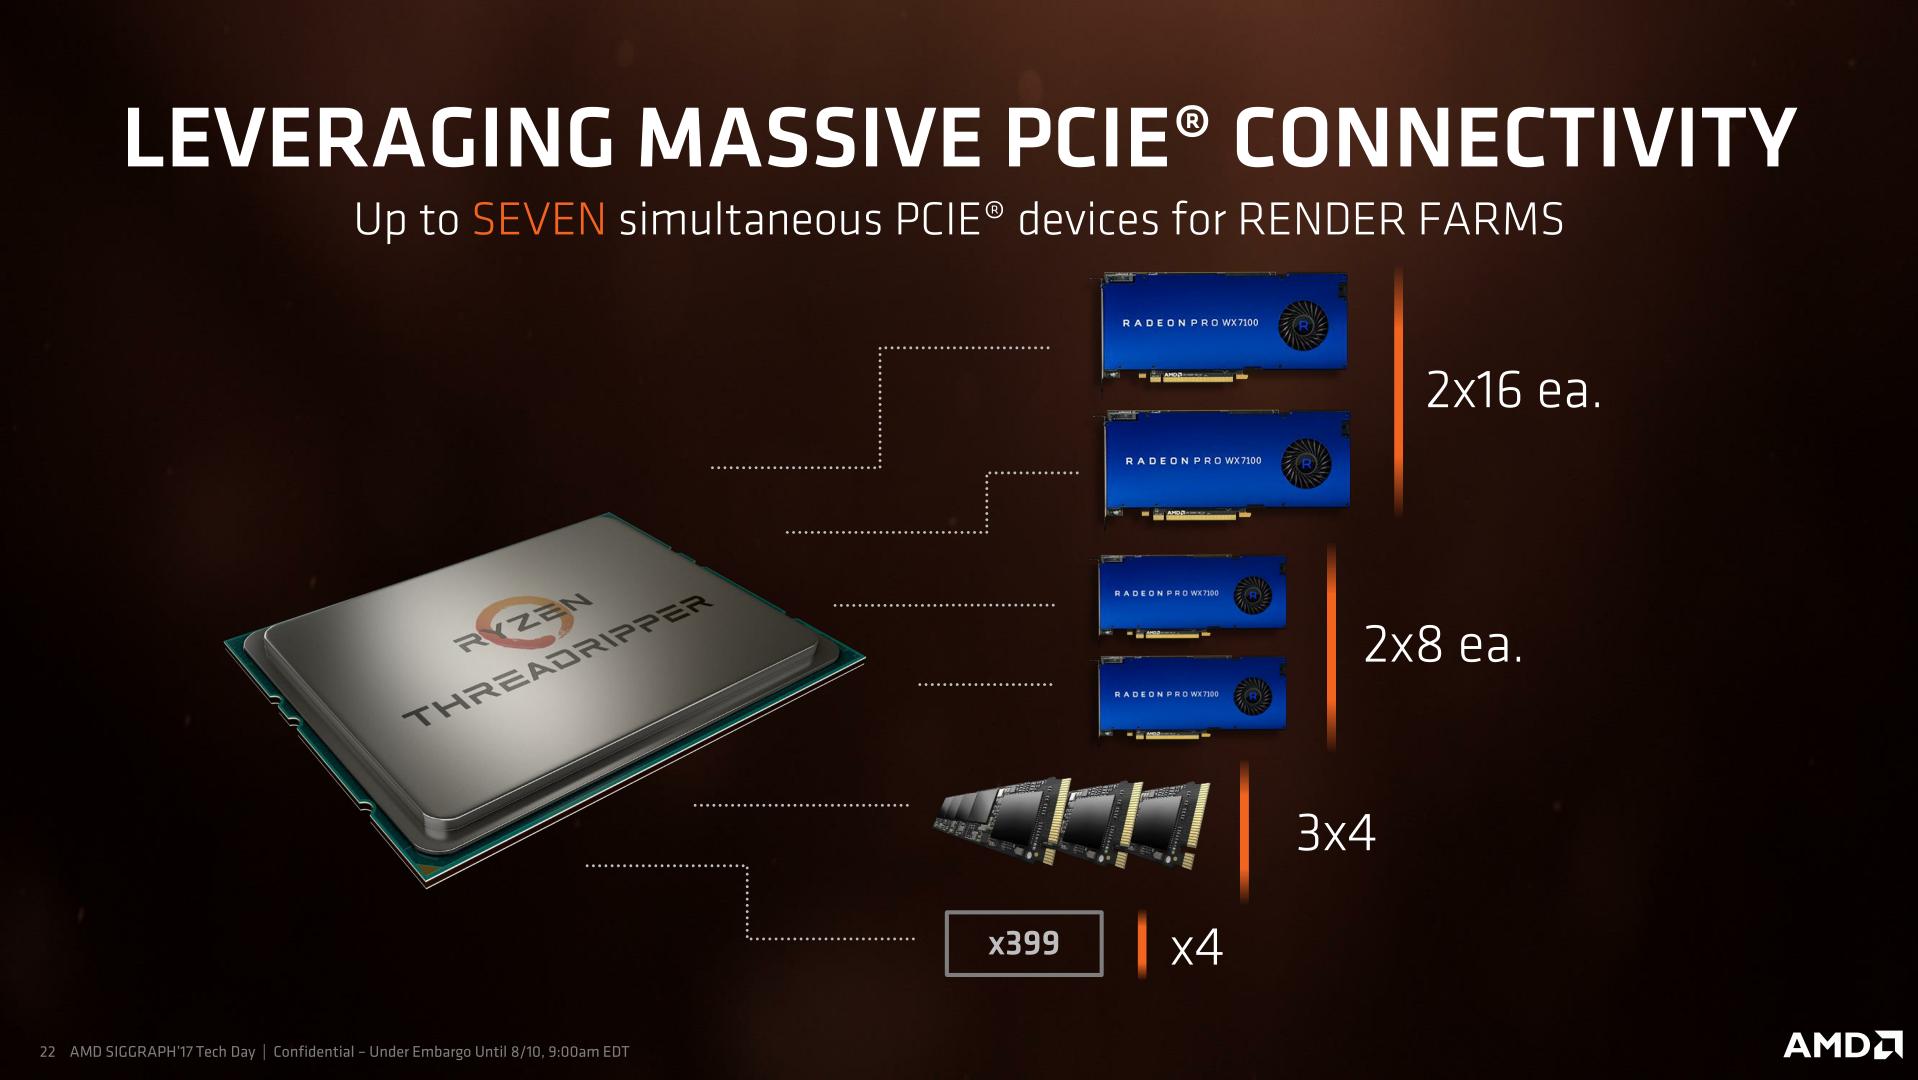
The goal of having so many PCIe lanes is to support the sort of market these processors are addressing: high-performance prosumers. These are users that run multiple GPUs, multiple PCIe storage devices, need high-end networking, high-end storage, and as many other features as you can fit through PCIe. The end result is that we are likely to see motherboards earmark 32 or 48 of these lanes for PCIe slots (x16/x16, x8/x8/x8/x8, x16/x16/x16, x16/x8/x16/x8), followed by a two or three for PCIe 3.0 x4 storage via U.2 drives or M.2 drives, then faster Ethernet (5 Gbit, 10 Gbit). AMD allows each of the PCIe root complexes on the CPU, which are x16 each, to be bifurcated down to x1 as needed, for a maximum of 7 devices. The 4 PCIe lanes going to the chipset will also support several PCIe 3.0 and PCIe 2.0 lanes for SATA or USB controllers.
Intel’s strategy is different, allowing 44 lanes into x16/x16/x8 (40 lanes) or x16/x8/x16/x8 (40 lanes) or x16/x16 to x8/x8/x8x8 (32 lanes) with 4-12 lanes left over for PCIe storage or faster Ethernet controllers or Thunderbolt 3. The Skylake-X chipset then has an additional 24 PCIe lanes for SATA controllers, gigabit Ethernet controllers, SATA controllers and USB controllers.
Top Trumps: DRAM and ECC
One of Intel’s common product segmentations is that if a customer wants a high core count processor with ECC memory, they have to buy a Xeon. Typically Xeons will support a fixed memory speed depending on the number of channels populated (1 DIMM per channel at DDR4-2666, 2 DIMMs per channel at DDR4-2400), as well as ECC and RDIMM technologies. However, the consumer HEDT platforms for Broadwell-E and Skylake-X will not support these and use UDIMM Non-ECC only.
AMD is supporting ECC on their Threadripper processors, giving customers sixteen cores with ECC. However, these have to be UDIMMs only, but do support DRAM overclocking in order to boost the speed of the internal Infinity Fabric. AMD has officially stated that the Threadripper CPUs can support up to 1 TB of DRAM, although on close inspection it requires 128GB UDIMMs, which max out at 16GB currently. Intel currently lists a 128GB limit for Skylake-X, based on 16GB UDIMMs.
Both processors run quad-channel memory at DDR4-2666 (1DPC) and DDR4-2400 (2DPC).
Top Trumps: Cache
Both AMD and Intel use private L2 caches for each core, then have a victim L3 cache before leading to main memory. A victim cache is a cache that obtains data when it is evicted from the cache underneath it, and cannot pre-fetch data. But the size of those caches and how AMD/Intel has the cores interact with them is different.
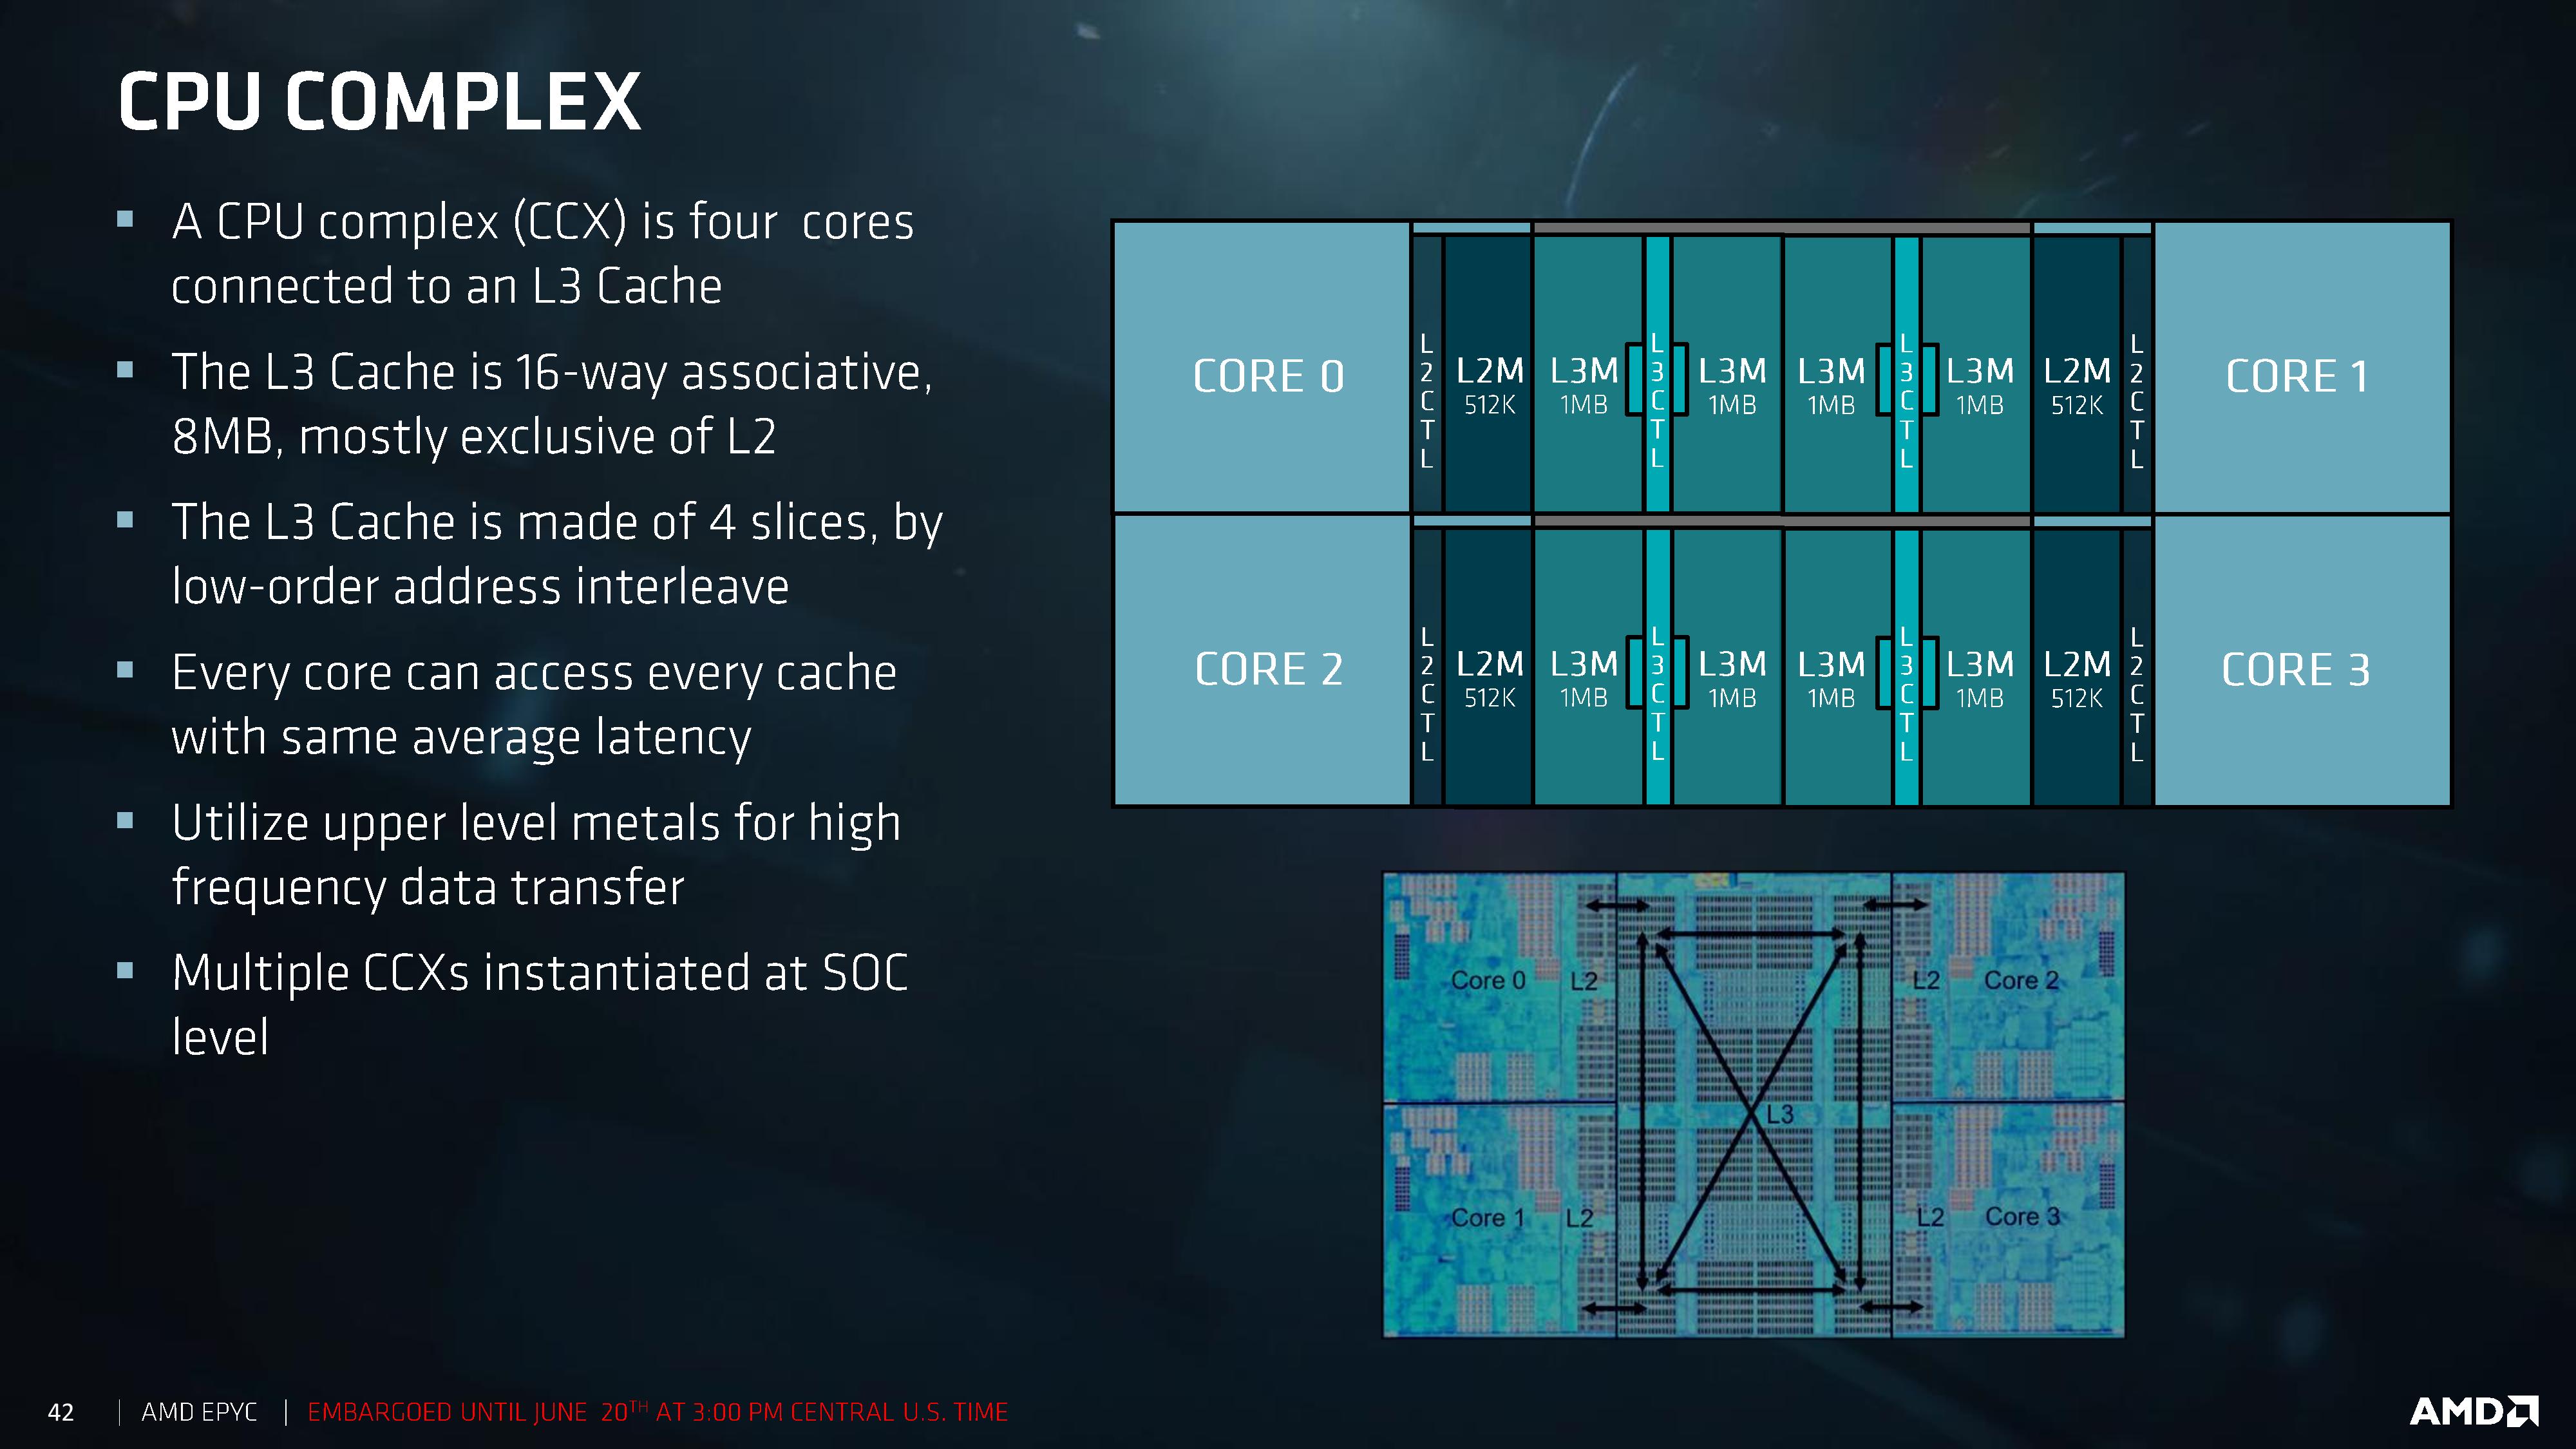
AMD uses 512 KB of L2 cache per core, leading to an 8 MB of L3 victim cache per core complex of four cores. In a 16-core Threadripper, there are four core complexes, leading to a total of 32 MB of L3 cache, however each core can only access the data found in its local L3. In order to access the L3 of a different complex, this requires additional time and snooping. As a result there can be different latencies based on where the data is in other L3 caches compared to a local cache.
Intel’s Skylake-X uses 1MB of L2 cache per core, leading to a higher hit-rate in the L2, and uses 1.375MB of L3 victim cache per core. This L3 cache has associated tags and the mesh topology used to communicate between the cores means that like AMD there is still time and latency associated with snooping other caches, however the latency is somewhat homogenized by the design. Nonetheless, this is different to the Broadwell-E cache structure, that had 256 KB of L2 and 2.5 MB of L3 per core, both inclusive caches.


347 Comments
View All Comments
blublub - Sunday, August 13, 2017 - link
From what I have read is that all TR do 3.9hhz and some even 4-4.1ghz on all cores .What are your temp when running all 10c @4.6ghz prime for 1-2hrs
Zingam - Sunday, August 13, 2017 - link
Ian, how about testing mobile CPUs - for games and for office work. Aren't mobile CPUs selling much larger numbers thatn desktop ones these days?I can't find a single benchmark comparing i5-7300hq vs i7-7700hq vs i7-7700K showing the difference in productivity workloads and not just for rendering pretty pictures but also for more specific tasks as compiling software etc.
I also would like to see some sort of comparison of new generation to all generations upto 10 years back in time. I'd like to know how much did performance increase since the age of Nehelem. At least from now on there should be a single test to display the relative performance increase over the last few generations. The average user doesn't upgrade their PC every year. The average user maybe upgrades every 5 years and it is really difficult to find out how much peformance increase would one get with an upgrade.
SanX - Sunday, August 13, 2017 - link
I agree, there must be 5-7 years old processors in the chartsSanX - Sunday, August 13, 2017 - link
Why one core of Apple A10 costs $10 but one core of Intel 7900x costs 10x more?oranos - Sunday, August 13, 2017 - link
so its complete dogsh*t for the segment which is driving the PC market right now: gaming. got it.ballsystemlord - Sunday, August 13, 2017 - link
Hey Ian, you've been talking about anandtech's great database where we can see all the cool info. Well, according to your database the Phenom II 6 core 1090T is equally powerful when compared to the 16 core threadripper!!!!!!! http://www.anandtech.com/bench/product/1932?vs=146With those sorts of numbers why would anyone plan an upgrade?
(And there is also only one metric displayed, strange!)
Not to play the Intel card on you as others do, but this is a serious problem for at least the AMD lineup of processors.
jmelgaard - Monday, August 14, 2017 - link
o.O... I don't know how you derived that conclusion? you need a guide on how to read the database?...BurntMyBacon - Monday, August 14, 2017 - link
For anyone looking for an overall fps for two pass encoding here is your equation (hope my math is correct):FPS = 2*FPS1*FPS2/(FPS2+FPS1)
No, you can't just average the FPS scores from each pass as the processor will spend more time in the slower pass.
For the x264 encoding test, for example, a few relevant FPS scores end up being:
i9-7900X: 122.56
i7-7820X: 114.37
i7-6900K: 95.26
i7-7740X: 82.74
TR-1950X: 118.13
TR-1950X(g): 117.00
TR-1920X: 111.74
R7-1800X: 100.19
Since two pass encoding requires both passes to be usable, getting an overall FPS score seems somewhat relevant. Alternately, using time to completion is would present the same information in a different manner. Though, it would be difficult to extrapolate performance results to estimate performance in other encodes without also posting the number of frames encoded.
goldgrenade - Thursday, January 4, 2018 - link
Take all those Intel FPS performance counters and multiply them by .7 and you have what their chips actually run at without a major security flaw in them.Let's see that would be...
i9-7900X: 85.792
i7-7820X: 80.059
i7-6900K: 66.682
i7-7740X: 57.918
And that's at best. It can be up to 50% degradation when rendering or having to do many small file accesses or repeated operations with KAISER.
Gastec - Tuesday, August 15, 2017 - link
I've having a hard time trying to swallow "Threadripper is a consumer focused product" line considering the prices to "consume" it: $550 for the MB, $550 for the TR1900X ($800 or $1000 for the others is just dreaming) then the RAM. The MB(at least the Asus one) should be $200 less, but I get it, they are trying to squeeze as much as possible from the...consumers. Now don't get me wrong and I mean no offence for the rich ones among you, but those CPU are for Workstations. WORK, not gamestations. Meaning you would need them to help you make your money, faster.