The Intel Skylake-X Review: Core i9 7900X, i7 7820X and i7 7800X Tested
by Ian Cutress on June 19, 2017 9:01 AM ESTBenchmarking Performance: CPU Rendering Tests
Rendering tests are a long-time favorite of reviewers and benchmarkers, as the code used by rendering packages is usually highly optimized to squeeze every little bit of performance out. Sometimes rendering programs end up being heavily memory dependent as well - when you have that many threads flying about with a ton of data, having low latency memory can be key to everything. Here we take a few of the usual rendering packages under Windows 10, as well as a few new interesting benchmarks.
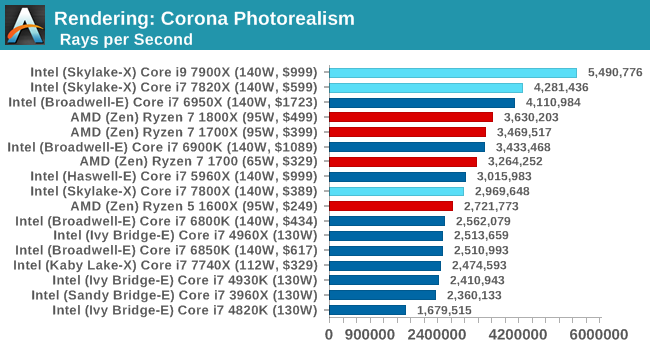
Corona 1.3
Corona is a standalone package designed to assist software like 3ds Max and Maya with photorealism via ray tracing. It's simple - shoot rays, get pixels. OK, it's more complicated than that, but the benchmark renders a fixed scene six times and offers results in terms of time and rays per second. The official benchmark tables list user submitted results in terms of time, however I feel rays per second is a better metric (in general, scores where higher is better seem to be easier to explain anyway). Corona likes to pile on the threads, so the results end up being very staggered based on thread count.
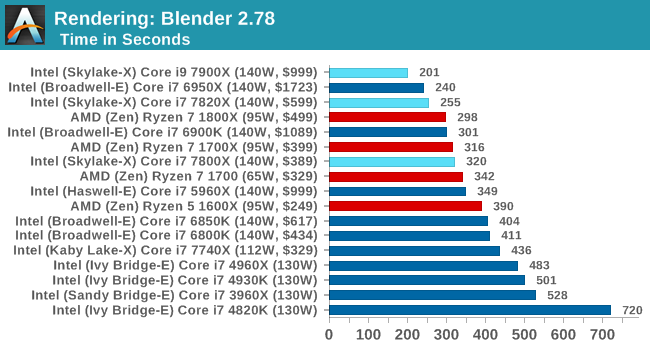
Blender 2.78
For a render that has been around for what seems like ages, Blender is still a highly popular tool. We managed to wrap up a standard workload into the February 5 nightly build of Blender and measure the time it takes to render the first frame of the scene. Being one of the bigger open source tools out there, it means both AMD and Intel work actively to help improve the codebase, for better or for worse on their own/each other's microarchitecture.
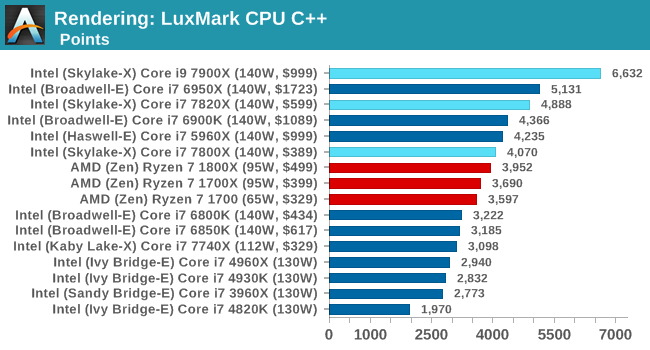
LuxMark
As a synthetic, LuxMark might come across as somewhat arbitrary as a renderer, given that it's mainly used to test GPUs, but it does offer both an OpenCL and a standard C++ mode. In this instance, aside from seeing the comparison in each coding mode for cores and IPC, we also get to see the difference in performance moving from a C++ based code-stack to an OpenCL one with a CPU as the main host.
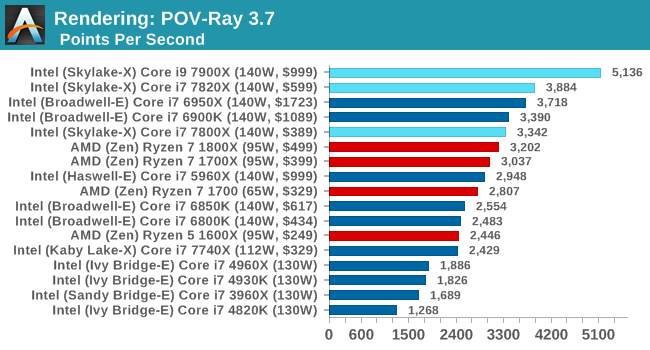
POV-Ray 3.7b3
Another regular benchmark in most suites, POV-Ray is another ray-tracer but has been around for many years. It just so happens that during the run up to AMD's Ryzen launch, the code base started to get active again with developers making changes to the code and pushing out updates. Our version and benchmarking started just before that was happening, but given time we will see where the POV-Ray code ends up and adjust in due course.
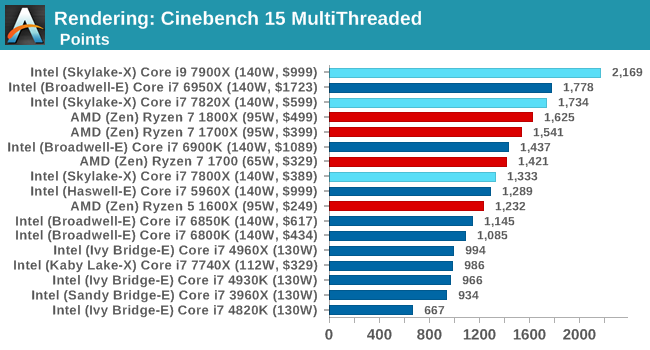
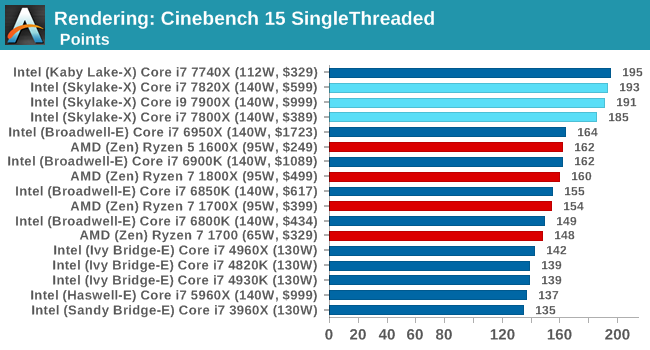
Cinebench R15
The latest version of CineBench has also become one of those 'used everywhere' benchmarks, particularly as an indicator of single thread performance. High IPC and high frequency gives performance in ST, whereas having good scaling and many cores is where the MT test wins out.


264 Comments
View All Comments
geekman1024 - Monday, June 19, 2017 - link
Zen is winning in one department: Price.Lolimaster - Tuesday, June 20, 2017 - link
Ryzen has a sick efficiency at lower clocks, that Ryzen 7 1700 65w can de undervolted further more and make it a 50w 3Ghz monster.sir_tech - Monday, June 19, 2017 - link
Why there are no power consumption charts in the review? Also, you should have gone ahead and post the gaming performance charts also just like Ryzen reviews.While the MSRP is high the actual retail price for Ryzen processors retail prices are much lower now.
Ryzen 7 1800x - $439 (MSRP - $499)
Ryzen 7 1700x - $349 (MSRP - $399)
Ryzen 7 1700 - $299 (MSRP - $329)
Ryzen 5 1600x - $229 (MSRP - $249)
Ryan Smith - Monday, June 19, 2017 - link
"Why there are no power consumption charts in the review?"Please refresh the conclusion.=)
"Also, you should have gone ahead and post the gaming performance charts also just like Ryzen reviews."
The BIOS updates have come so late that we don't even have a complete dataset for the new BIOSes. Ian had just enough time to make sure they were still screwy, and then was on a plane. We're going to need to sit down and completely redo all the Skylake-X chips once the platform stabilizes to the point where our results won't be immediately invalidated.
cheshirster - Monday, June 19, 2017 - link
Your DDR4-2400 tests of 1800X and 1600X are already invalidated.And RoTR
There was no problem with publishing bad gaming results for AMD.
What's the problem with 2066?
Ryan Smith - Monday, June 19, 2017 - link
If we had a complete, up-to-date dataset to publish, and time to write it up, we would have. If only to showcase why eager gamers should wait for the platform to mature a bit.cheshirster - Monday, June 19, 2017 - link
Sorry, with this text:"Our GTX1080 seems to be hit the hardest out of our four GPUs, as well as Civilization 6, the second Rise of the Tomb Raider test, and Rocket League on all GPUs. As a result, we only posted a minor selection of results, most of which show good parity at 4K"
+ ryzen bad fullhd results in RoTR and Rocket League fully published.
You are going straigh to the Hall of Fame of typical brand loyalists.
jospoortvliet - Thursday, June 22, 2017 - link
Well the state of Ryzen wasn't as bad as this and it isn't like it was not pointed out in this review.Also I am sure other benchmarks were also affected making Intel look worse in benchmark databases thanks to their rush job...
bongey - Wednesday, August 2, 2017 - link
Yep you bashed Ryzen in gaming in your review, quit lying."Gaming Performance, particularly towards 240 Hz gaming, is being questioned,"
Gasaraki88 - Monday, June 19, 2017 - link
Everything is on default, no overclocking.