HiSilicon Kirin 960: A Closer Look at Performance and Power
by Matt Humrick on March 14, 2017 7:00 AM EST- Posted in
- Smartphones
- Mobile
- SoCs
- HiSilicon
- Cortex A73
- Kirin 960
CPU Power Consumption and Thermal Stability
CPU Power Consumption
Taking into account Kirin 950’s excellent performance and power efficiency and ARM’s claim that its A73 CPU consumes 20%-30% less power than Kirin 950’s A72 cores (same process, same frequency), it’s only logical to expect Kirin 960 to be the new efficiency king. Before earning that distinction, however, the 960’s A73 cores need to be physically implemented on silicon, and there are many factors—process and cell library selection, critical path optimizations, etc.—that ultimately determine processor efficiency.
To get a feel for CPU power consumption, I used a power virus with different thread counts to artificially load the cores. Using each device’s onboard fuel gauge, the active power was calculated by subtracting the device’s idle power, where it was doing nothing except displaying a static screen, from the total power for the given scenario. This method compensates for the power used by the display and other hardware components, but it’s not perfect; there’s no way to separate power consumed by certain necessary blocks, such as SoC interconnects, memory controllers, or DRAM, so the figures below include some additional overhead. This is especially true for the “1 Core” figures, where SoC interconnects and busses first ramp to higher frequencies.
| System Active Power: CPU Load + Per CPU Core Increments (mW) |
||||
| SoC | 1 Core | 2 Cores | 3 Cores | 4 Cores |
| Kirin 960 Cortex-A73 @2.362GHz |
1812 | 2845 | 4082 | 5312 |
| - | +1033 | +1237 | +1230 | |
| Kirin 955 Cortex-A72 @2.516GHz |
1755 | 2855 | 4040 | 5010 |
| - | +1100 | +1185 | +970 | |
| Kirin 950 Cortex-A72 @2.304GHz |
1347 | 2091 | 2844 | 3711 |
| - | +744 | +753 | +867 | |
| Exynos 7420 Cortex-A57 @2.1GHz |
1619 | 2969 | 4186 | 5486 |
| - | +1350 | +1217 | +1300 | |
| Snapdragon 810 v2.1 Cortex-A57 @1.958GHz |
2396 | 5144 | 8058 | not allowed |
| - | +2748 | +2914 | - | |
| Snapdragon 820 Kryo @2.150GHz / 1.594GHz |
2055 | 3330 | 4147 | 4735 |
| - | +1275 (2.150GHz) |
+817 (1.594GHz) |
+588 (1.594GHz) |
|
| Snapdragon 821 Kryo @2.342GHz / 1.594GHz |
1752 | 3137 | 3876 | 4794 |
| - | +1385 (2.342GHz) |
+739 (1.594GHz) |
+918 (1.594GHz) |
|
| Kirin 960 Cortex-A53 @1.844GHz |
654 | 885 | 1136 | 1435 |
| - | +231 | +251 | +299 | |
| Kirin 935 Cortex-A53 @2.2GHz |
1062 | 1769 | 2587 | 3311 |
| - | +707 | +818 | +724 | |
Surprisingly, the Kirin 960’s big CPU cores consume more power than the Kirin 950’s A72s—up to 43% more! This is a complete reversal from ARM’s goals for the A73, which were to reduce power consumption and improve sustained performance by reducing the thermal envelope. There’s no way for us to know for sure why the Kirin 960 uses more power at its highest operating point, but it’s likely a combination of implementation and process.
The Kirin 950 uses TSMC’s 16FF+ FinFET process, but HiSilicon switches to TSMC’s 16FFC FinFET process for the Kirin 960. The newer 16FFC process reduces manufacturing costs and die area to make it competitive in mid- to low-end markets, giving SoC vendors a migration path from 28nm. It also claims to reduce leakage and dynamic power by being able to run below 0.6V, making it suitable for wearable devices and IoT applications. Devices targeting price-sensitive markets, along with ultra low-power wearable devices, tend to run at lower frequencies, however, not 2.36GHz like Kirin 960. It’s possible that pushing the less performance-oriented 16FFC process, which targets lower voltages/frequencies, to higher frequencies that lay beyond its peak efficiency point may partially explain the higher power consumption relative to 16FF+.
The differences we’re seeing between Kirin 960 and 950 are unlikely to come from the difference in process alone, however. Implementation plays an even bigger role and allows a semiconductor company to get the most performance/power/area from a given process. HiSilicon did a great job with the Kirin 950 on 16FF+, which is why its efficiency is so good. This was always going to be a tough act to follow, and despite the similarities between 16FF+ and 16FFC from a design perspective, it’s still a different process with different requirements. It’s impossible to say how close HiSilicon came to the optimal solution, though, because we have no other examples of A73 on 16FFC for comparison.
The Kirin 960’s peak power figures are actually very close to what I measured for Kirin 955, the higher-clocked version of the Kirin 950. Its per-core increases are similar to the Exynos 7420’s lower-frequency A57 cores too, only about 50mW less.
The Kirin 960’s A73 cores consume less power than the two high-performance Kryo cores in Snapdragon 820/821, though, using up to 2.8W for two cores versus 3.1W to 3.3W for two Kryo cores. The quad-core Snapdragons’ remaining two cores run at a lower peak frequency and consume less power, nullifying Kirin 960’s power advantage when using 3-4 cores.
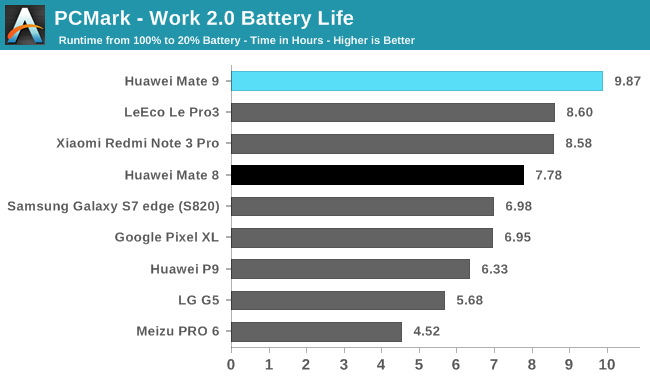
Despite the higher power consumption at the CPU’s highest operating points, Huawei’s Mate 9 actually does very well in our battery life tests. Its 13.25 hours of screen on time in our Wi-Fi Web Browsing test is a full 3 hours more than the Mate 8, and its nearly 10 hours in PCMark 2.0 is 27% better than the Mate 8. These real-world battery life results seem to be at odds with our CPU power measurements.
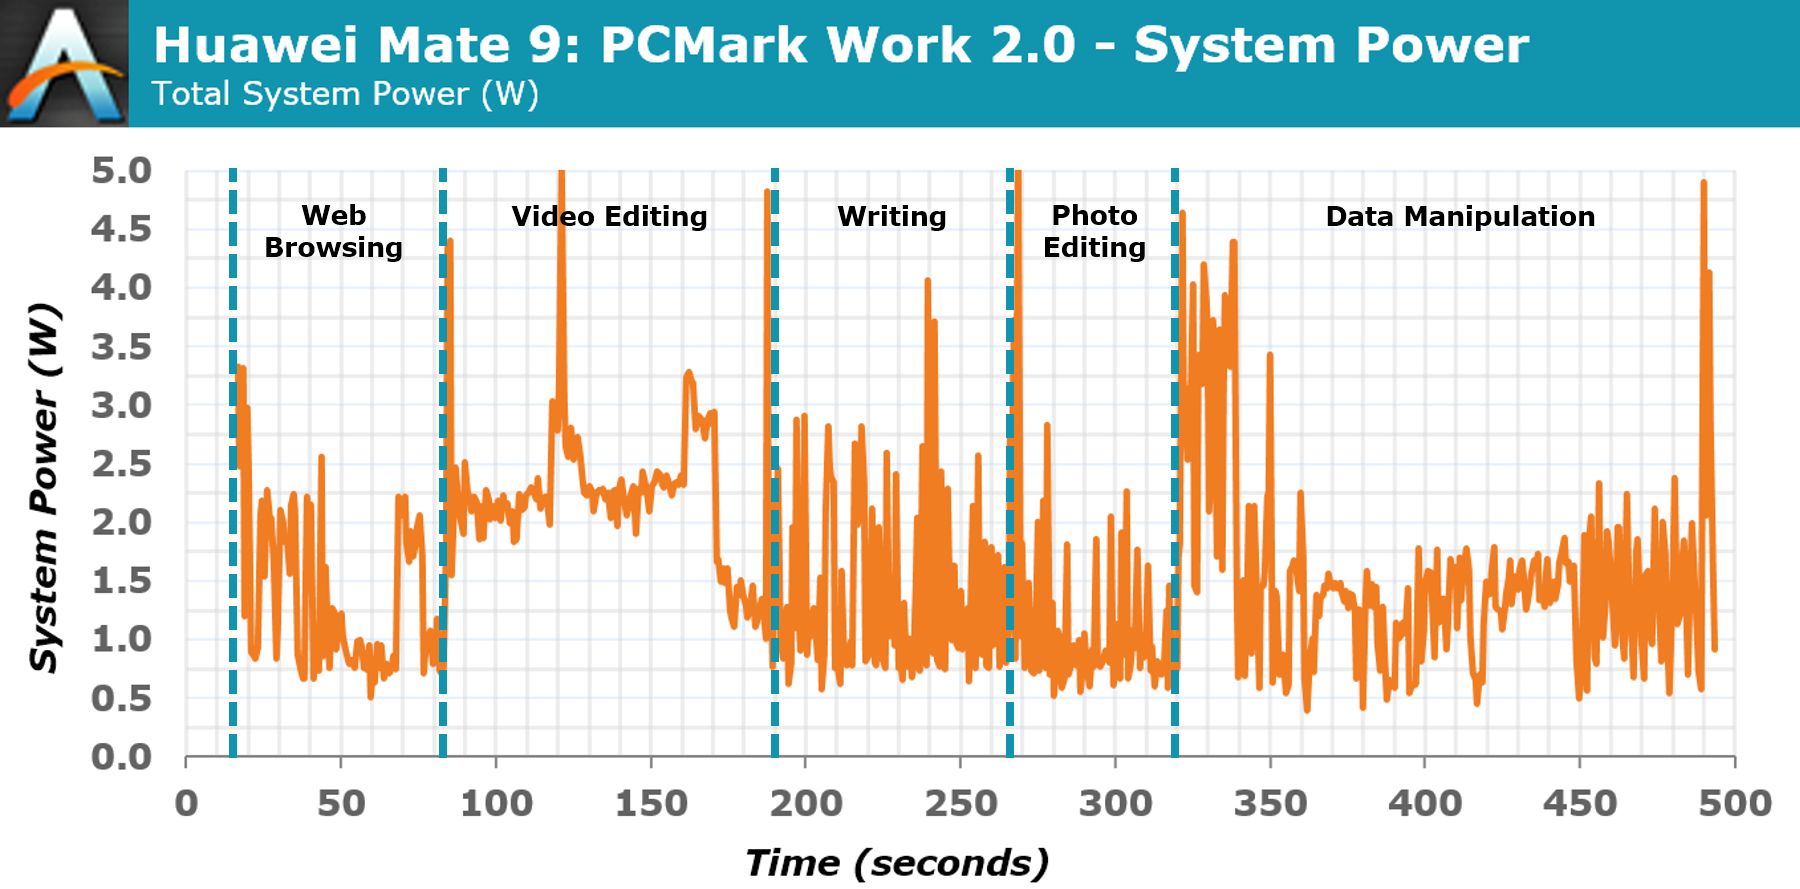
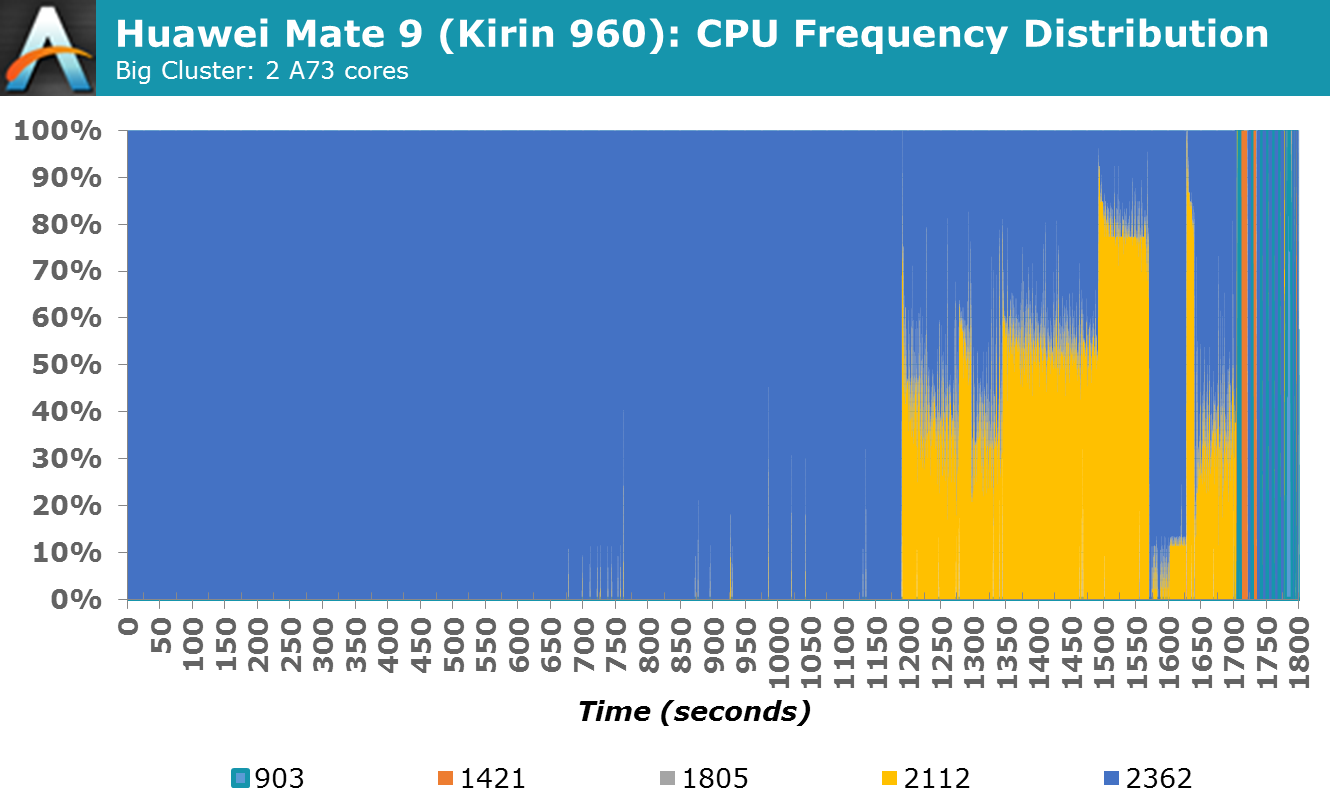
The graph above shows the Mate 9’s total system power consumption while running the PCMark 2.0 performance tests (all radios were turned off and the display’s brightness was calibrated to only 10 nits to better isolate the power consumption of the internal components). With the exception of some power spikes caused by increased activity while loading the next test, total power consumption remains below 3W and generally below 2W, well under the 5.3W we measured from Kirin 960’s four big cores.
I’m showing this graph because most of the apps we use everyday behave similarly to PCMark, where we see threads migrate from the little cores to the big cores and back again and DVFS working hard to match CPU frequency with load (actually, most apps would show significantly more CPU idle time, so PCMark is still a bit extreme in this regard). Many workloads will only use 1-2 big cores too, like we see here with PCMark. With only 2 cores at their max operating point, the Kirin 960 only consumes 754mW more power than Kirin 950 instead of 1601mW more when using 4 cores. So while CPU efficiency is certainly important, we need to frame it in terms of real-world workloads, and we also cannot forget the impact software (scheduler, CPUfreq, CPUidle) has on overall battery life.
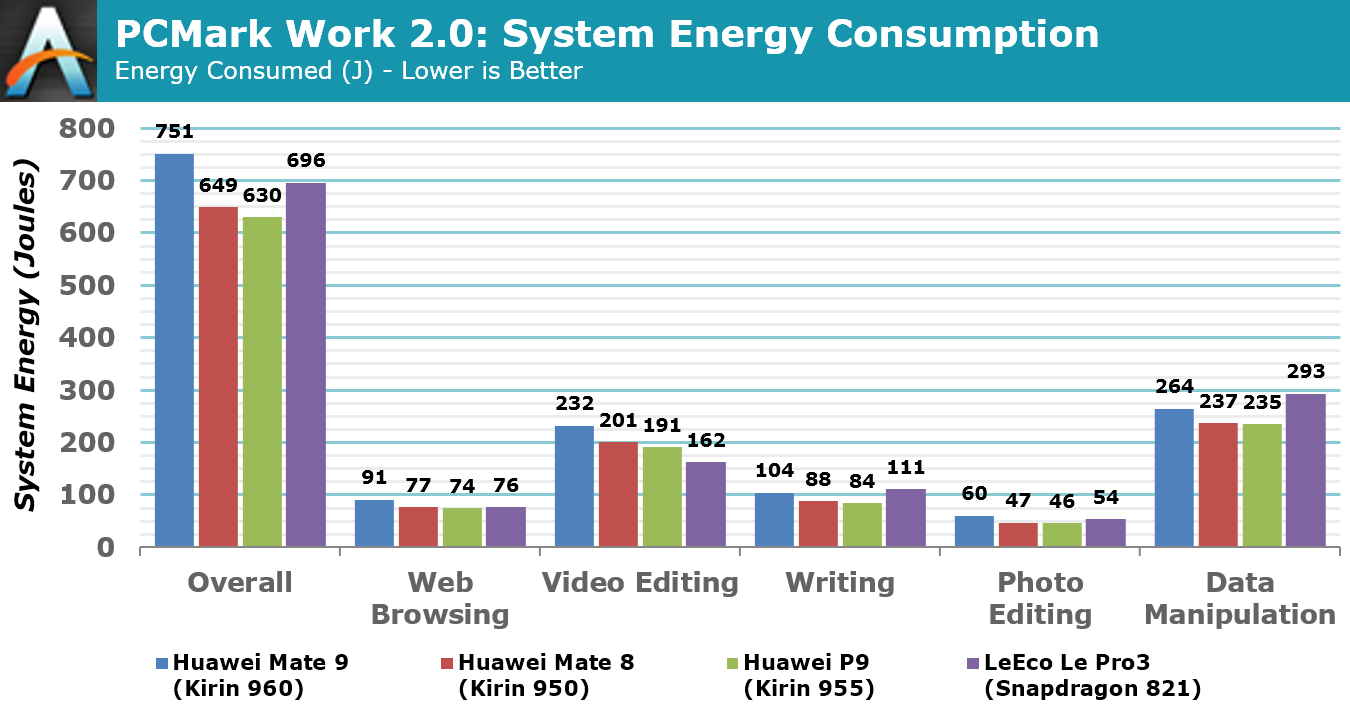
Looking at power alone can be misleading; a device may use more power than another, but if it completes the task in less time, it may actually use less energy, leading to longer battery life. For both of the graphs above, the phones’ radios were turned off and their displays calibrated to only 10 nits (the lowest common setting) to reduce the impact of different screen sizes and efficiencies from skewing the results.
In the first graph, which shows the total energy consumed by each phone when running the PCMark 2.0 performance tests, the Mate 9 consumes 16% more energy overall than the Mate 8 (despite my efforts to minimize display influence, the P9’s energy consumption is slightly lower than the Mate 8’s, which is likely because of its smaller screen). The Video and Photo Editing tests, which employ the GPU, show some of the biggest percent differences, but the Writing test, which makes frequent use of the CPU’s big cores, also shows a larger than average difference. The LeEco Le Pro3 and its Snapdragon 821 SoC actually consumes more energy than the Mate 9 in the Data Manipulation and Writing tests, where it has to use its 2 high-performance Kryo cores, but less in the Video and Photo Editing tests that use the GPU.
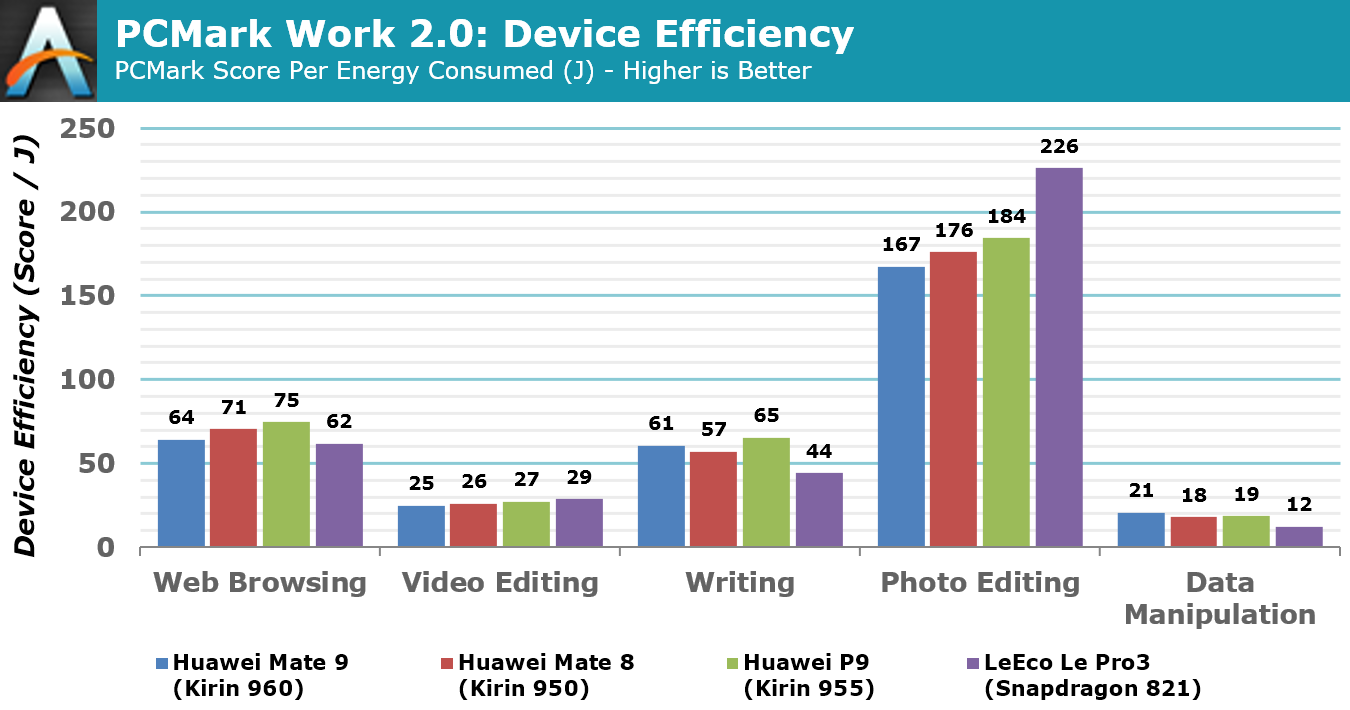
The second graph divides the PCMark score by the energy consumed to show efficiency. Because of the Mate 9’s better performance, it’s actually 7% more efficient than the Mate 8 in the Writing test and 17% more efficient in the Data Manipulation test. The Mate 9’s GPU efficiency is the worst of the group, judging by its scores in the Video and Photo Editing tests. In contrast, the Pro3’s Adreno 530 GPU posts the highest efficiency values in these tests.
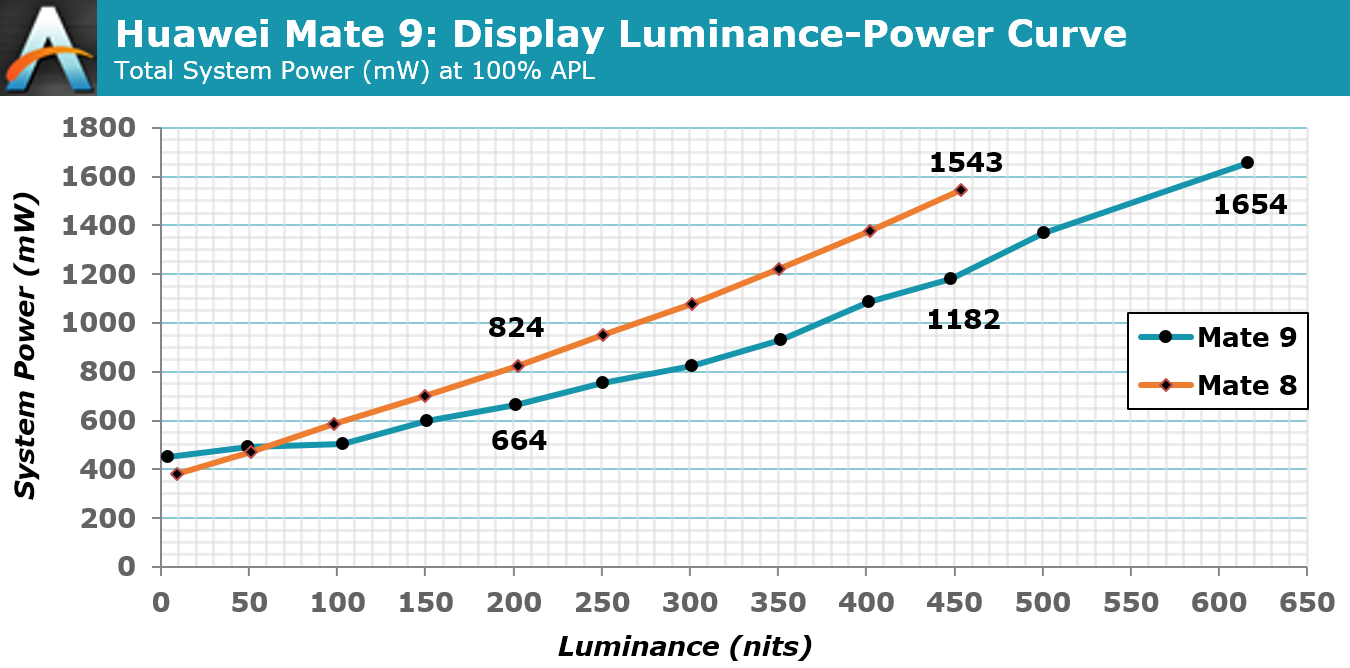
The Mate 9 lasts longer than the Mate 8 in the PCMark battery test despite its Kirin 960 SoC consuming more energy, so Huawei must have reduced energy consumption elsewhere to compensate. The display is the most obvious place to look, and the graph above clearly shows that the Mate 9’s display is more efficient. At 200 nits, the value we use for our battery tests, the Mate 9 shows an estimated 19% power reduction. In the time it takes to run PCMark, this translates to 82 J of energy, nearly erasing the 102 J difference between the Mate 9 and Mate 8. I suspect the difference in display power may actually be a little bigger, but I lack the equipment to make a more precise measurement. This still does not account for all of the Mate 9’s power savings, however, but a full accounting is beyond the scope of this article.
CPU Thermal Stability
Our CPU throttling test uses the same power virus we used above with two threads running on two of the big A73 CPU cores for a duration of about 30 minutes. The goal is to determine a device’s ability to sustain peak CPU performance without throttling and potentially reducing user experience. This is a product of CPU power consumption, the device’s ability to dissipate heat, and the device’s thermal safety limits.
The Mate 8 and its Kirin 950 are able to sustain peak performance with two A72 cores indefinitely, a remarkable feat. The Mate 9 does not fare as well because of Kirin 960’s elevated power use; however, it still manages to hold two of its A73 cores at peak frequency for 11.3 minutes and does not throttle enough to affect performance in a noticeable way for 20 minutes, which is still a very good result. I cannot think of any CPU-centric workloads for a phone that would load two big cores for anywhere near this long, so it’s safe to say that CPU throttling is not a problem for the Mate 9. It will be interesting to see if this holds true for Huawei’s smaller phones such as the P10, which will not be able to dissipate heat as readily as the big, aluminum Mate 9.


86 Comments
View All Comments
MajGenRelativity - Tuesday, March 14, 2017 - link
I'm a dunce sometimes. I totally missed that. Thank you Ian!fanofanand - Tuesday, March 14, 2017 - link
I love that you have begun moderating (to a degree) the comments section! It's nice to have someone with so much knowledge there to dispel the FUD! Not saying his question was bad, but I really do like that you are getting in the mud with us plebs :)MajGenRelativity - Tuesday, March 14, 2017 - link
My question wasn't bad, just stupid :P Should have read that page a little more closely.fanofanand - Tuesday, March 14, 2017 - link
I didn't mean to imply your question was bad at all, and I certainly wasn't lumping you in with those spreading FUD, but Ian has become a growing presence in the comments section and I for one like what he's doing. The comments section in nearly every tech article has become ugly, and having a calming, logical, rational presence like Ian only helps to contribute to a more polite atmosphere where disagreement can be had without presuming that the person with an opposing viewpoint is Hitler.MajGenRelativity - Tuesday, March 14, 2017 - link
I thought this was the Internet, where the opposing viewpoint is always Hitler? :Pfanofanand - Tuesday, March 14, 2017 - link
Hitler has become omnipresent, now the Barrista who underfoams your latte must be Hitler!lilmoe - Tuesday, March 14, 2017 - link
Shouldn't this provide you with even more evidence that max frequency workloads are super artificial, and are completely unrepresentative of normal, day-to-day workloads? This further supports my claim in earlier article comments that chip designers are targeting a certain performance target, and optimizing efficiency for that point in particular.I keep saying this over and over (like a broken record at this point), but I do firmly believe that the benchmarking methodology for mobile parts of the entire blogsphere is seriously misleading. You're testing these processors the same way you would normally do for workstation processors. The author even said it himself, but the article contradicts his very statement. I believe further research/investigations should be done as to where that performance target is. It definitely defers from year to year, with different popular app trends, and from OS upgrade to another.
Spec, Geekbench and browser benchmarks, if tested in context of same device, same OS upgrades, are a good indication of what the chip can artificially achieve. But the real test, I believe, is launching a website, using facebook, snapchat, etc., and comparing power draw of various chips, since that's what these chips were designed to run.
There's also the elephant in the room that NO ONE is accounting for when testing and benchmarking, and that's touch input overhead. Most user interaction is through touch. I don't know about iOS, but everyone knows that Android ramps up the clock when the touchscreen detects input to reduce lag and latency. Your browser battery test DO NOT account for that, further reducing its potential credibility as a valid representation of actual usage.
I mention touch input clock ramps in particular because I believe this is the clock speed that OEMs believe it delivers optimal efficiency on the performance curve for a given SoC, at least for the smaller cluster. A better test would be logging the CPU clocks of certain workloads, and taking the average, then calculating the power draw of the CPU on that particular average clock.
This is where I believe Samsung's SoCs shine the most. I believe they deliver the best efficiency for common workloads, evident in the battery life of their devices after normalization of screen size/resolution to battery capacity.
Worth investigating IMO.
fanofanand - Tuesday, March 14, 2017 - link
If you can come up with a methodology where opening snapchat is a repeatable scientific test, send your hypothesis to Ryan, I'm sure he will indulge your fantasy.lilmoe - Tuesday, March 14, 2017 - link
Yea, we all love fantasies. Thing is, in the last couple of paragraphs, Matt literally said that the entirety of the review does not match with the actual real-world performance and battery life of the Mate 9.But sure, go ahead and keep testing mobile devices using these "scientific" conventional anyway, since it makes readers like fanofanand happy.
close - Tuesday, March 14, 2017 - link
That is, of course, an awesome goal. Now imagine the next review the battery life varies between 10 and 18 hours even on the same phone. Now judge for yourself if this kind of result is more useful to determine which phone has a better battery life. Not only is your real world usage vastly different from mine (thus irrelevant) but you yourself can't even get through 2 days with identical battery life or identical usage. If you can't determine one phone's battery life properly how do you plan on comparing that figure to the ones I come up with?If you judged your comment by the same standards you judge the article you wouldn't have posted it. You implicitly admit there's no good way of testing in the manner you suggest (by refusing or being unable to provide a clearly better methodology) but still insisted on posting it. I will join the poster above in asking you to suggest something better. And don't skimp on the details. I'm sure that if you have a reasonable proposal it will be taken into consideration not for your benefit but for all of ours.
Some of these benchmarks try to simulate a sort of average real world usage (a little bit of everything) in a reproducible manner in order to be used in a comparison. That won't be 100% relevant but there is a good overlap and it's the best comparative tool we've got. Your generic suggestion would most likely provide even less relevant figures unless you come up with that better scenario that you insist on keeping to yourself.