Choosing the Right SSD for a Skylake-U System
by Ganesh T S on May 9, 2016 8:00 AM ESTM.2 SSD Options for the Skylake NUC
The M.2 2280 slot in the NUC6i5SYK supports both PCIe and SATA SSDs. The PCIe SSDs (up to Gen3 x4) can be either NVMe or AHCI. A detailed comparison of Non-Volatile Memory Express (NVMe) and the Advanced Host Controller Interface (AHCI) is beyond the scope of this review, but one of our previous articles provides further information. For the purpose of this piece, it is sufficient to know that NVMe SSDs have advantages in performance over AHCI SSDs. SATA SSDs, as seen from the block diagram in the previous section, are connected to the chipset via a SATA III 6Gbps link.
There are plenty of SSDs compatible with the Intel NUC6i5SYK, but, what does one choose for the best experience? There are decisions to make - PCIe 3.0 vs. PCIe 2.0, NVMe vs. AHCI, PCIe vs. SATA and so on. Obviously, a PCIe 3.0 x4 NVMe SSD is the best in terms of performance, but, it might not be great on the wallet, or even for power consumption. In this review, we are going to look at four M.2 SSD options:
- Samsung SM951 256GB PCIe 3.0 x4 NVMe
- Samsung 950 PRO 512GB PCIe 3.0 x4 NVMe
- Kingston HyperX Predator 240GB PCIe 2.0 x4 AHCI
- Mushkin Atlas Vital 250GB SATA 6Gbps
The table below smmarizes the specifications (claimed by the manufacturers) for the various evaluated SSDs. The entries in bold indicate the features corresponding to the tested sample.
| Evaluated M.2 2280 SSDs - Specifications | ||||
| Drive | Samsung SM951 | Samsung SSD 950 PRO | Kingston HyperX Predator | Mushkin Atlas Vital |
| Available Capacities | 128GB, 256GB, 512GB | 256GB, 512GB | 240GB, 480GB | 120GB, 240GB, 250GB, 480GB, 500GB |
| Interface | PCIe 3.0 x4 | PCIe 3.0 x4 | PCIe 2.0 x4 | SATA III |
| Supported Protocols | NVMe, AHCI | NVMe | AHCI | AHCI |
| Evaluated Model | MZVPV256HDGL | MZVKV512 | SHPM2280P2/480G | MKNSSDAV250GB-D8 |
| Controller | Samsung UBX S4LN058A01-8030 |
Marvell Altaplus 88SS9293 |
SandForce SF-2281VB4-SPC | |
| NAND | Samsung 16nm 64Gbit MLC | Samsung V-NAND 32-layer 128Gbit MLC | Toshiba A19nm 64Gbit MLC | MLC |
| DRAM | 512MB | 1GB | - | |
| Sequential Read | 2150MB/s | 2500MB/s | 1400MB/s | 550MB/s |
| Sequential Write | 1260MB/s | 1500MB/s | 1000MB/s | 530MB/s |
| 4KB Random Read | 300K IOPS | 300K IOPS | 117K IOPS | 86K IOPS |
| 4KB Random Write | 100K IOPS | 110K IOPS | 70K IOPS | 86K IOPS |
| Endurance | 75TBW | 400TBW | 892TBW (1.7 DWPD) | N/A |
| Street Price (as on date) | $200 | $318 | $300 | $90 |
| Warranty | OEM / Unknown | Five years | Three years | |
The rest of this section will present more information about each of these SSDs as well as a quick look at their CrystalDiskMark scores, when used in the M.2 slot of the NUC6i5SYK. It must be noted that CrystalDiskMark is an artificial benchmark. Nonetheless, it is useful to determine whether the SSDs are operating as per the manufacturer's claimed specifications. It can also help in finding out whether the SSD is connected via the most optimal interface. For example, it can quickly reveal whether a PCIe x4 SSD is inadvertently being operated in the x1 mode (which is entirely possible due to BIOS settings in certain systems).
Samsung SM951 MZVPV256HDGL 256GB PCIe 3.0 x4 NVMe SSD
The SM951 is an OEM-only M.2 2280 SSD. The 256GB variant is a single-sided card with two flash packages, a single DRAM package and the controller on the top side. In the Skylake NUC, the thermal strip attached to the lid is able to make contact with all the chips on the SSD to aid in cooling down the components.
The gallery below presents some photographs of the sample used in our review.


The screenshots below show the CrystalDiskMark v5.0.2 scores of the SM951 in the Skylake NUC6i5SYK with BIOS v0042 on the left and the new development BIOS (v1142) on the right.
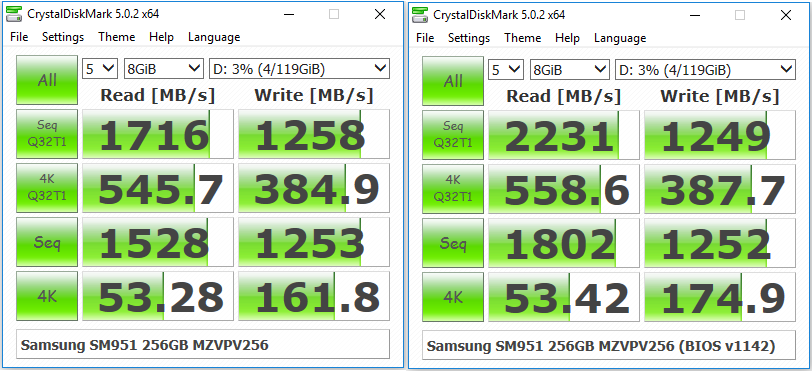
As expected, the change from OPI GT2 to OPI GT4 unlocks the full performance potential of the SM951 PCIe 3.0 x4 NVMe SSD. There is no change in the write speeds, but the maximum read rates go up from 1716 MBps to 2231 MBps.
Samsung SSD 950 PRO MZVKV512 512GB PCIe 3.0 x4 NVMe SSD
The SSD 950 PRO uses the same controller as the SM951. This product is available in the retail channel, unlike the SM951. The main selling point here is the V-NAND, which enables higher endurance ratings (up to 400TB of writes). Like the SM951, despite the higher capacity, the 950 PRO is also single-sided. A label across the top prevents the thermal pad on the NUC lid from coming in direct contact with the packages. As we shall see later, our 950 PRO test sample runs a little bit hotter for the same workload as compared to the SM951.
The gallery below presents a couple of photographs of the sample used in our review.


The screenshots below show the CrystalDiskMark v5.0.2 scores of the SSD 950 PRO in the Skylake NUC6i5SYK with BIOS v0042 on the left and the new development BIOS (v1142) on the right.

As expected, and already seen with the SM951, the change from OPI GT2 to OPI GT4 is required in order to take advantage of the full capabilities of the SSD.
Kingston HyperX Predator SHPM2280P2H/480G 480GB PCIe 2.0 x4 AHCI SSD
Kingston was one of the very few vendors to jump on to the PCIe bandwagon for consumer SSDs. The HyperX Predator PCIe 2.0 x4 SSDs adopt the traditional AHCI protocol, and not the NVMe used by the two Samsung SSDs discussed above. The main selling point of these units is the high endurance ratings compared to the Samsung SSDs. Kingston's three-year warranty period, coupled with a 1.7 drive writes per day (DWPD) rating for the 480GB version comes out to an endurance rating of more than 890TBW.
The SSDs come either in a pure M.2 version, or, bundled along with a half-height / half-length (HHHL) adapter to fit traditional desktop motherboards that don't have a M.2 slot. The HHHL adapter also includes a thermal pad on the underside to keep the components cooled. The 480GB version is populated with eight flash packages (four on either side). The pricing on the various available options (240GB and 480GB, with and without the HHHL adapter) is a bit volatile. I have often seen the HHHL bundle available at a lower price compared to the pure M.2 version.
Kingston sent us the 480GB HHHL version for consideration in this piece. Some photographs of the package and the contents are presented in the gallery below. We again have a label covering the packages and preventing the thermal pad on the NUC lid from doing an effective job of keeping the SSD cool.


The screenshots below show the CrystalDiskMark v5.0.2 scores of the Kingston HyperX Predator M.2 SSD in the Skylake NUC6i5SYK with BIOS v0042 on the left and the new development BIOS (v1142) on the right.
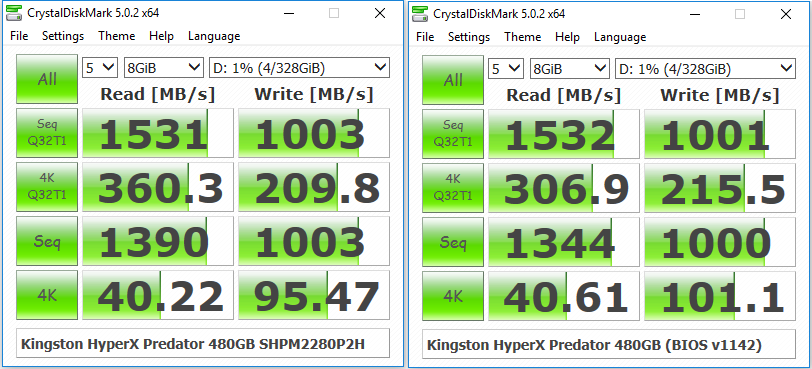
The move from OPI GT2 to OPI GT4 is not expected to make any difference to PCIe 2.0 x4 SSDs, and this is proved by our quick test above.
Mushkin Atlas Vital MKNSSDAV250GB-D8 250GB SATA M.2 SSD
Mushkin has been selling SandForce SF2200-based SSDs for a long time. The DRAM-less nature of the controller means that the the board footprint for the SandForce SSDs tends to be small. Due to this, Mushkin has been able to migrate the designs from 2.5" drives to mSATA and now, down to M.2 form factors. The Atlas Vital is the M.2 version of their SF2200-based drive.
The early review samples of the 250GB Atlas Vital that were seeded to the press used the SF2241 quad-channel controller, but our sample had the eight-channel SF2281 controller. There are only two flash packages on board (making it a single-sided design), though it can be seen that the board is designed to accommodate up to eight packages. Mushkin packages the NAND themselves, and there is no guarantee who the vendor is (except that it is MLC flash). The gallery below shows some photographs of the unit used in our review.


The screenshots below show the CrystalDiskMark v5.0.2 scores of the Mushkin Atlas Vital SSD in the Skylake NUC6i5SYK with BIOS v0042 on the left and the new development BIOS (v1142) on the right.
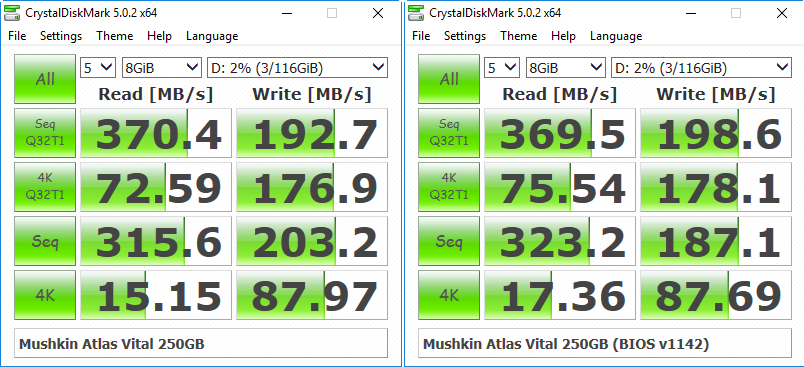
The SSD is presented here as a value proposition, and is not meant to lead the performance charts obviously. The SATA interface is the main limitation, and the OPI GT2 or GT4 rates have no effect on the performance of the SSD.
Do these artificial benchmark numbers have any bearing on the performance of the drive in real-world workloads that might be run on Skylake-U systems? The next few sections attempt to address that question.


40 Comments
View All Comments
AnnonymousCoward - Monday, May 9, 2016 - link
When will AnandTech realize that synthetic hard drive benchmarks are utterly pointless?http://techreport.com/review/29221/samsung-950-pro...
It's not like you'd round up several graphics cards that produce the same fps, and only run synthetic tests on them to try to show which is fastest. That would be foolish. And that's what's being done with SSDs.
You go as far to claim "those involving heavy multimedia editing and frequent transfers of large-sized files, the PCIe SSDs can definitely provide tangible benefits." How do you know?? If you look at the actual data (in the techreport site), load times of 500-800MB files were pretty much a wash across all the drives. You're misleading readers by only showing PCMark8 and claiming there are tangible benefits.
ganeshts - Monday, May 9, 2016 - link
Dude, did you even read the full article - particularly, the place where the graphs for the 'AnandTech DAS Suite' are displayed? Those graphs are the places where tangible benefit is shown for the PCIe SSDs.In fact, the only place where I have put in 'synthetic hard drive benchmarks' was the CrystalDiskMark comparisons when introducing the four SSDs. Again, that was prefaced with this text: "...it is useful to determine whether the SSDs are operating as per the manufacturer's claimed specifications. It can also help in finding out whether the SSD is connected via the most optimal interface. ..."
In fact, we set out with this article with the sole intention to use ONLY real-world, application-based benchmarks. Please read the article at least once before putting forward an accusation in its comments section.
AnnonymousCoward - Monday, May 9, 2016 - link
It really is a great article, it's well-written, and an interesting read. I'm only focusing on the lack of _real_ real-world benchmarks.You consider SYSmark, PCMark, and DAS to be real-world, but the problem is they aren't. First, I highly question the accuracy: in an actual load time situation, I seriuosly doubt the 950 Pro will be 5x faster than the Mushkin, as PCMark and DAS show. Secondly, these benchmark programs don't give a tangible understanding: seeing a load time difference in "seconds" is tangible, but seeing scores of a thousand is not.
It's really easy to prove this to yourself: use a stopwatch on anything with a load time. If the times are less than 3x of each other (more likely, within 10%) then it will be evident that PCMark and DAS are lying.
ganeshts - Tuesday, May 10, 2016 - link
SYSmark is real-world. Look at their whitepaper if you haven't had a chance to try it out. It actually runs the applications and keeps track of how much time it takes to complete tasks - and it actually shows there is little to no difference between a PCIe AHCI SSD operating at 2.0 x4 and a NVMe SSD operating at 3.0 x4.PCMark - I have linked the PDFs which show how much time it took to complete each workload (real-world trace). The SATA SSD takes around 2 seconds more than the NVMe SSD - and between AHCI and NVMe, it is 0.2 - 0.3s.
The DAS stuff is pretty much as real world as it can be. You have 250GB of data to transfer from one partition to another. The SATA SSD takes 4x the time of the PCIe NVMe SSD. The instantaneous bandwidth numbers are presented in the graph for you to see. Are you saying I am misrepresenting facts?
SYSmark and PCMark are _real_real-world benchmarks - as real-world as you can get if you want highly repeatable benches with reproducible scoring , not something a tech site cooks up on its own (like our DAS suite - which has its own reasons for existence - since we developed it, we can instrument it in ways not possible with third-party benchmarks).
Where does PCMark and DAS say they are representing load time situations? Did you take a look at the PDFs? The PDFs show how much difference is there for the real workload of manipulating images with Photoshop etc. The bandwidth numbers generated by PCMark - I clearly state it is artificial and assumes workload that is not CPU-bound. You should look at the Storage Score to get an idea of how much faster SSD X would be over SSD Y. The bandwidth numbers are only to indicate how the SSDs would perform in a storage-bound situation - Read the explanation preceding the graph.
The DAS suite doesn't talk about load time at all - it notes time taken to transfer a large amount of data from one partition to another. You can see your tangible 'seconds' in those graphs.
Stopwatch and stuff - at the risk of sounding like a broken watch - check the PDFs of the PCMark 8 storage bench results.
rossjudson - Tuesday, May 10, 2016 - link
I'm not sure why FIO isn't used for your benchmarking. Doesn't have the pretty graphs, but it's got scalability and rigor. You're not going to use Crystal to find out how well a PCIe SSD performs at 600K IOPS, or what happens when you're writing maximum sequential load to 4 of them in a single system."What can this hardware do?" and "How will this affect my workload?" are different questions, for sure. I think your application-level benchmarks are quite useful for answering the second. But perhaps not so much for the first.
Or maybe Crystal Diskmark is super-awesome, and FIO's not needed any more. ;)
AnnonymousCoward - Wednesday, May 11, 2016 - link
Your points look technically sound and you clearly have a far better understanding of those benchmark suites than me. The thing is, though, this is confusing. It's not obvious how to take 4 benchmark program results and know how actual computer usage precisely compares.AT got it right here: http://www.anandtech.com/print/1371/ Load times are easy to comprehend and apply to what we care about! And shockingly, RAID-0 won every suite but marginally lost in the simple use-case test.
I can tell you a lot of people have a misconception that RAID-0 SSDs or the 950 Pro load things >3% faster. [reference to the data: http://www.tomshardware.com/reviews/samsung-950-pr...] The misconception is propagated by reviews that show a bunch of graphs with big performance differences and an omission of simple use-cases. I guess users buying a NUC care about boot time, app load time, etc. Why not show the difference. That would certainly be more meaningful than any *Mark suite.
Agent Smith - Monday, May 9, 2016 - link
Not so quick to apologise eah?Experientia docet
Kvaern2 - Monday, May 9, 2016 - link
Much can be read in a username.MrSpadge - Monday, May 9, 2016 - link
"Please read the article at least once before putting forward an accusation in its comments section."Non, no! That's not how the internets are supposed to work ;)
MrSpadge - Monday, May 9, 2016 - link
(Oops, meant to reply to Ganesh's post)