The Toshiba Q300 SSD Review: Toshiba Becomes a Retail Brand
by Billy Tallis on February 26, 2016 8:00 AM ESTPerformance Consistency
Before we start things off, I would like to cover a quick housekeeping note. Over the winter I've made some changes to the SSD testbed and our benchmarking procedures, with the goal of streamlining the process as much as possible while still producing results that are directly comparable with our 2015 benchmark scores. Performance testing is conducted with drives in a hot-swap bay so that they can be pulled from the testbed to be securely erased and pre-filled by a separate computer. I still have to manually move the drives around between phases of our benchmark suite, but the entire process of running the tests and parsing the results to generate graphs for the review is now automated and much less error prone. The new process also keeps more of the raw data around, so in future reviews I may experiment with new ways to graph what we're measuring. The Toshiba Q300's close similarity to the OCZ Trion 100 has helped validate the new procedures.
With that out of the way, we start things off with our performance consistency test, which explores the extent to which a drive can reliably sustain performance during a long-duration random write test. Specifications for consumer drives typically list peak performance numbers only attainable in ideal conditions. The performance in a worst-case scenario can be drastically different as over the course of a long test drives can run out of spare area, have to start performing garbage collection, and sometimes even reach power or thermal limits.
In addition to an overall decline in performance, a long test can show patterns in how performance varies on shorter timescales. Some drives will exhibit very little variance in performance from second to second, while others will show massive drops in performance during each garbage collection cycle but otherwise maintain good performance, and others show constantly wide variance. If a drive periodically slows to hard drive levels of performance, it may feel slow to use even if its overall average performance is very high.
To maximally stress the drive's controller and force it to perform garbage collection and wear leveling, this test conducts 4kB random writes with a queue depth of 32. The drive is filled before the start of the test, and the test duration is one hour. Any spare area will be exhausted early in the test and by the end of the hour even the largest drives with the most overprovisioning will have reached a steady state. We use the last 400 seconds of the test to score the drive both on steady-state average writes per second and on its performance divided by the standard deviation.
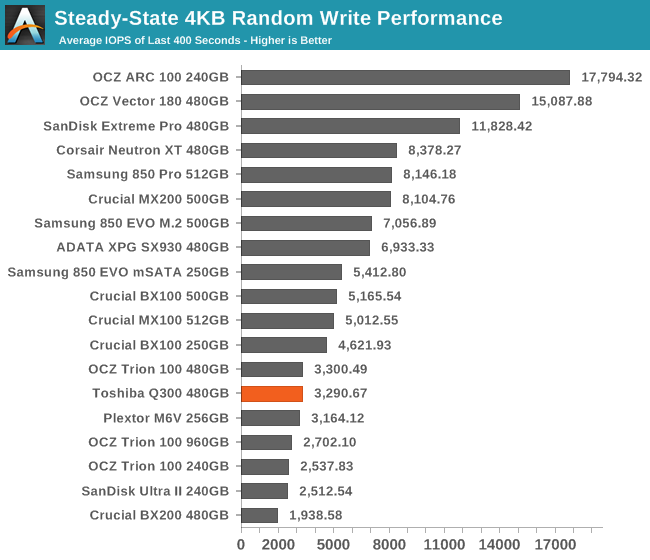
The Q300's steady-state performance is on par with the Trion 100: low, but well above the Crucial BX200 and SanDisk Ultra II. The latter drive uses SanDisk's second-generation 19nm TLC that is made on the same process as the flash in the Q300.
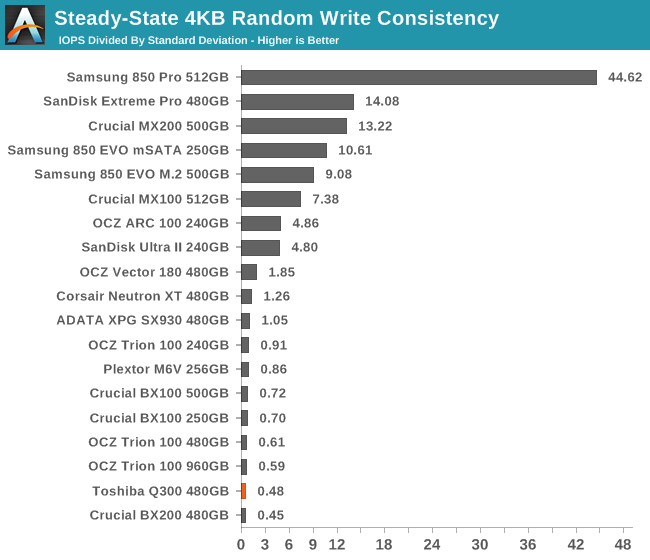
The write consistency of the Q300 is poor, but that's the case for most low-end drives - even the ones using MLC flash. As long as the performance has a reasonably high floor, a lot of variance is tolerable for client workloads. The Q300 is noticeably less consistent than the Trion 100.
 |
|||||||||
| Default | |||||||||
| 25% Over-Provisioning | |||||||||
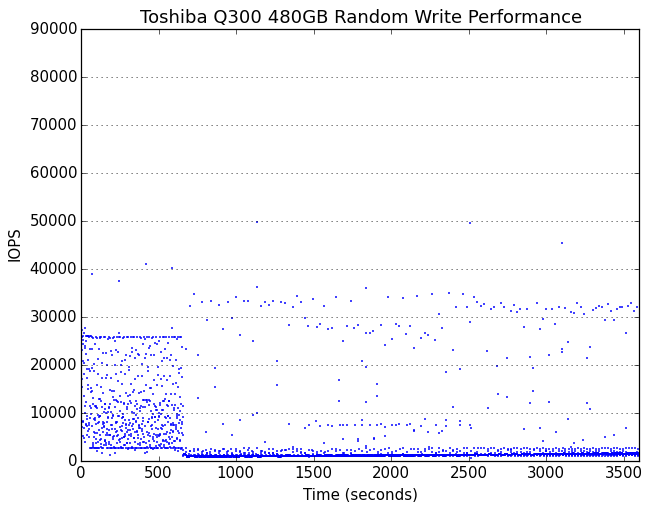
It takes about ten minutes of full-speed writing for the Q300 to burn through its spare area, which is pretty good. The steady state that it reaches is mostly consistent save for some extreme outliers.
 |
|||||||||
| Default | |||||||||
| 25% Over-Provisioning | |||||||||
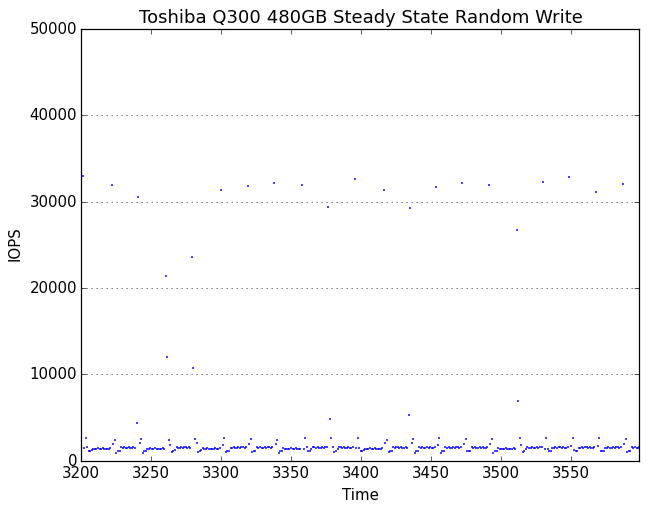
The Q300's steady-state write performance is around 1500 IOPS with several brief excursions per minute up to 30k+ IOPS. With extra space reserved, the variance increases and the steady state ranges from about 1100 IOPS to about 5500 IOPS.


30 Comments
View All Comments
kmmatney - Friday, February 26, 2016 - link
I upgraded my laptop from a Samsung 830 to a SanDisk Ultra II 980GB (TLC + SLC cache) and the Ultra II is noticeably faster in everyday use. Anand reviewed it a while back and it was one of the lower powered drives as well - in fact more efficient than MX100 according to the review.Oyster - Friday, February 26, 2016 - link
I have a radical suggestion, guys. Can you please start review articles with the price comparison? This (price comparison) just seems out of place since the rest of the product attributes are already being compared to the competition on the first page. I often find myself jumping between the first and the last pages just to compare items. Plus there have been times when I have just skipped to the last page just for the price comparison... case in point, some of the ridiculously-priced mechanical keyboards - I know they're not even worth my time at $150.Also, when are you implementing single-page views??? :)
nathanddrews - Friday, February 26, 2016 - link
Hopefully never. If you want single-page, just click "Print This Article":http://www.anandtech.com/print/10084/the-toshiba-q...
aggressor - Friday, February 26, 2016 - link
Is this really considered their first retail drive? What about the Toshiba THNSNH model they released in 2013? I have one of them and it was retail boxed.jjj - Friday, February 26, 2016 - link
You should include PCIe drives in the results as prices are becoming more reasonable and the high end SATA models less appealing.ddriver - Friday, February 26, 2016 - link
Toshiba needs to reevaluate their pricing - 140$ for the 480GB model is far from a good deal considering that for 20$ extra you can get an evo which is significantly faster, has significantly longer warranty period and has 20GB extra capacity.mczak - Friday, February 26, 2016 - link
I wonder how the different Q300 differ and compare to each other?There's two series available: Q300 RG4 (models starting with HDTS7xxx) and Q300 RG5 (HDTS8xxx). The RG5 seems to be newer, I assume different flash (the tested one can be identified as a RG4 in the picture). But for all I know they could have completely different characteristics despite Toshiba wanting to believe you it's all the same...
mczak - Friday, February 26, 2016 - link
I suppose actually flash is going to be the difference - 15nm vs 19nm, so it would be like a Trion 150 (though the Trion 150 had 3 differences vs. the Trion 100, 15nm flash instead of 19nm, newer firmware (with larger SLC buffer), plus a thermal pad for the controller chip, the latter was likely the reason it had faster sustained write performance, and those other differences might not carry over to the Q300 - so there might not be much difference in the end after all).harrynsally - Friday, February 26, 2016 - link
?????? it appears that Toshiba's strategy may have been to use the Trion 100's earlier release to make sure everything was working properly before releasing the Q300 to catch the eye of a wider audience??????Just checked Newegg Trion 100 owner reviews.
44% rated the 120GB drive 1 star and 41% rated the 240GB drive 1 star.
Appears that OCZ SSDs still lack in quality, reliability and performance,
wagon153 - Friday, February 26, 2016 - link
You're taking Newegg reviews serious? Lol. The Kingston V300 has 4 stars and is as bad, if not worse then, old OCZ drives.